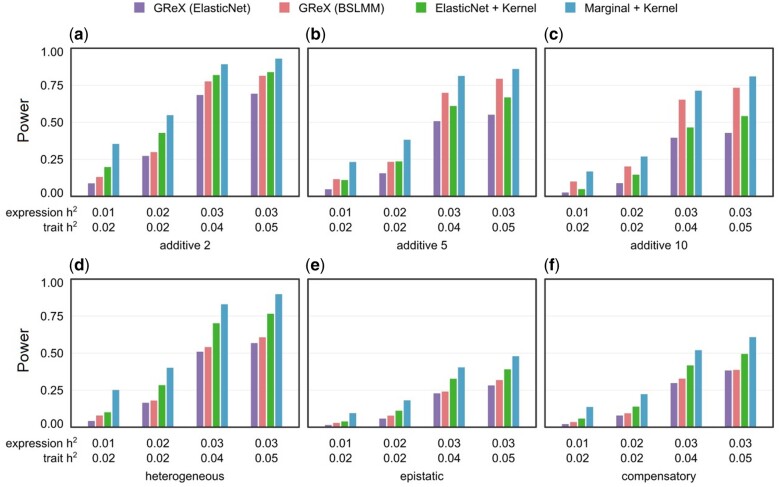
Figure 2.
Power comparison of protocols in simulated pleiotropy scenario. The pleiotropic scenario simulates independent associations from genotype to phenotype and expressions (see Supplementary Figure S1 and Online Methods). Power is indicated on the y-axis. (A–C) are results under an additive genetic architecture, with differing expression heritability and local trait heritability denoted below each panel. The total number of contributing genetic variants is 2, 5, and 10 in each panel (left to right). (D–F) are results under interaction architectures, with expression heritability and local trait heritability denoted below. From left to right, the specific interactions are heterogeneous (logical “OR”), epistatic (logical “AND”), and compensatory (logical “XOR”).

