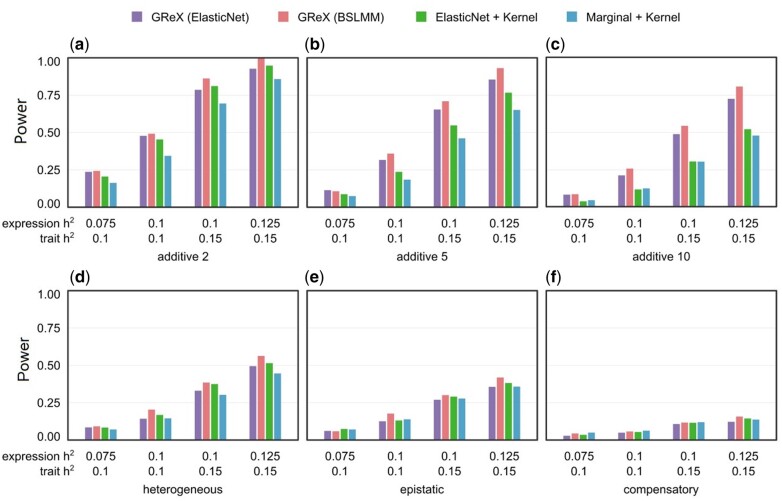
Figure 3.
Power comparison of protocols in simulated causality scenario. The causality scenario simulates dependence of phenotype on genotype via gene expression (see Supplementary Figure S1 and Online Methods). Panels (A–F) have the same layout as Figure 4.

