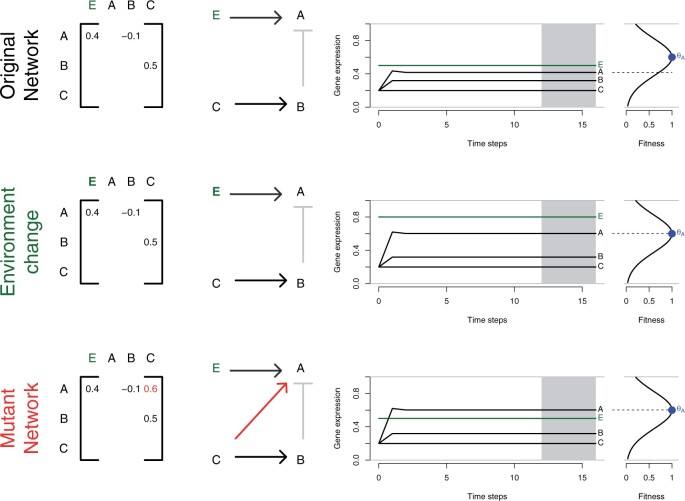
Figure 1.
Gene network model. An original network with three genes (A, B, C) and an environmental sensor gene (E) is illustrated. The genotype of an individual is provided by the matrix of interactions (left panel), which provides the strength and direction (middle panel) of regulatory interactions: A is a plastic gene influenced by E (and B), B is up-regulated by C but its expression does not depend on the environment, C is not regulated and therefore expressed constitutively (level of expression set to 0.2). This example assumes that selection targets only the expression of gene A, which optimum is independently from the environment. Top row: expression of E is set to 0.5. The kinetics of the network during 16 time-steps shows a rapid stabilization after three steps, the expression of the genotype is, however, distant from the expression target which represents a fitness cost (fitness < 1). Middle row: upon an environmental change (expression of E changes from 0.5 to 0.8), the expression of the genotype reaches the expression target, and the fitness is maximal. Bottom row: Without environmental change, maximum fitness can be reached with a mutant network whereby C now regulates A; such a mutant network would have a fitness advantage over the original network in this environment. The variance of expression is computed for each gene on the four last time-steps (shaded area), and networks which have not reached a stable state at that point (non-null variance) suffer a fitness penalty.

