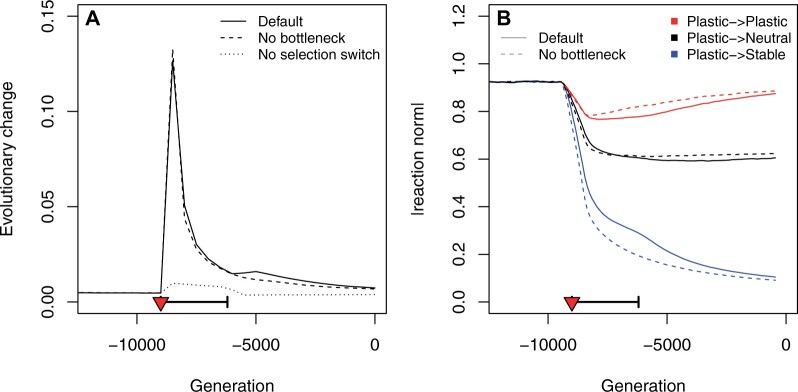
Figure 3.
Changes in the rate of evolution and in plastic reaction norms upon domestication. (A) Speed of evolutionary change in the regulatory network as measured by the Euclidean distance between the regulation strengths of successive (500 generations apart) average genotypes . Three scenarios are illustrated: full maize domestication (Default, plain lines), no bottleneck (hyphenated lines), no selection switch (dotted lines). The selection switch and population bottleneck are indicated as a red triangle and a thick horizontal segment, respectively. (B) Evolution of the average reaction norm for genes that were selected to be plastic before domestication. Two scenarios are illustrated: maize full domestication (Default, plain lines), and no bottleneck (hyphenated lines). Red lines stand for genes selected to remain plastic after domestication, black lines indicate genes that were unselected in anthropic conditions, and blue lines genes that were selected to lose their expression plasticity.

