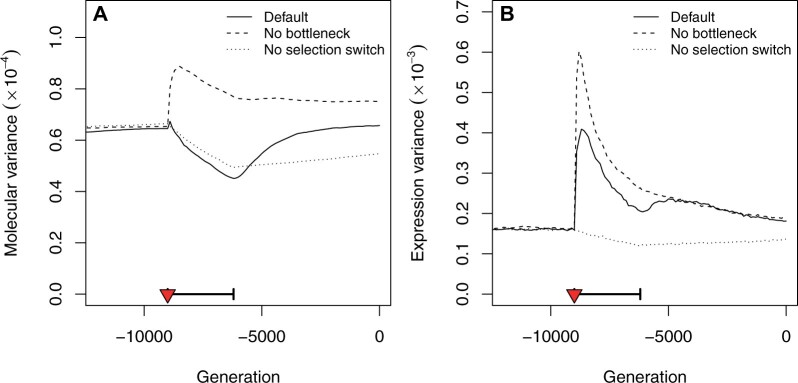
Figure 4.
Evolution of genetic and expression variation through time. The population neutral molecular variance (A) was estimated from the regulation sensitivity to unexpressed transcription factors, which measures the genetic diversity at neutral loci that are in complete linkage disequilibrium with the network genes. The population expression variance (B) stands for the within-population “phenotypic” variance of gene expressions, averaged over all genes. The selection switch and population bottleneck are indicated as a red triangle and a thick horizontal segment, respectively. The figure shows the average over 1000 simulations for each scenario (same scenarios as in Figures 2 and 3A).

