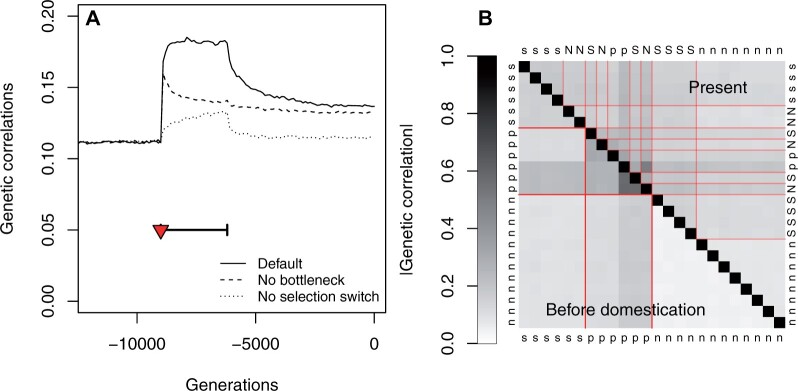
Figure 5.
Consequences of domestication on gene coexpression. (A): Evolution of the average absolute value of within-population genetic correlations. The selection switch and population bottleneck are indicated as a red triangle and a thick horizontal segment, respectively, for the same three scenarios as in Figure 2. (B) Average genetic correlation for each pair of genes, at generation −9000 (just before the onset of domestication) below the diagonal, and at generation 0 (last generation of the simulations), above the diagonal. Gene selection status is indicated (n: nonselected; s: stable; p: plastic); capital letters indicate genes whose selection status changed during domestication. Red lines delimitate gene categories, before and after domestication. The two groups of plastic genes correspond to genes selected to correlate positively and negatively with the environmental index.

