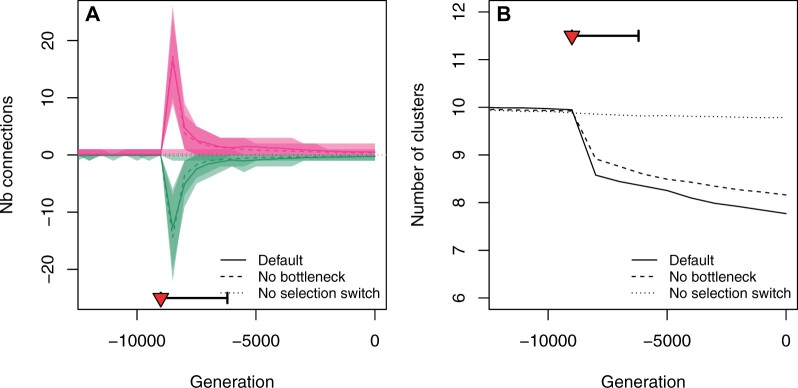
Figure 6.
Evolution of gene network properties. The presence/absence of a regulatory connection was determined based on its effect on gene expression (see Materials and Methods). (A) Connection gains (pink) and losses (green) were counted over windows of 500 generations. The drop in the number of clusters (B) corresponds to new connections among existing clusters. The selection switch and population bottleneck are indicated as a red triangle and a thick horizontal segment, respectively. The three scenarios are the same as in Figure 2.

