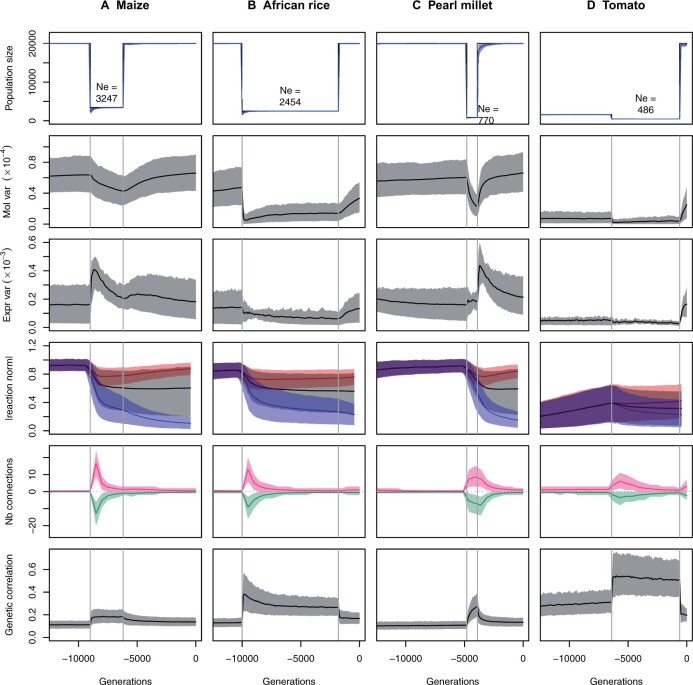
Figure 7.
Influence of the domestication scenario on the simulation results. (A) Maize domestication scenario (for reference); (B) African rice; (C) pearl millet; and (D) tomato. The four scenarios differ by the timing, strength, and duration of the bottleneck, by the demography before and after the bottleneck, and by the selfing rate (Table 1). Plain lines represent the average of each variable over 1000 simulations, shaded areas stand for the 10–90% quantiles. First row: census and effective population sizes. Census sizes are model parameters, effective population sizes were estimated from the variance in fitness (see Materials and Methods). Effective population sizes indicated in the figure were computed as the harmonic mean over the whole bottleneck. Second row: molecular variance, as in Figure 4A. Third row: expression variance, as in Figure 4B. Fourth row: average reaction norm, as in Figure 3B. Fifth row: number of connections, as in Figure 6A. Sixth row: average genetic correlation, as in Figure 5A.

