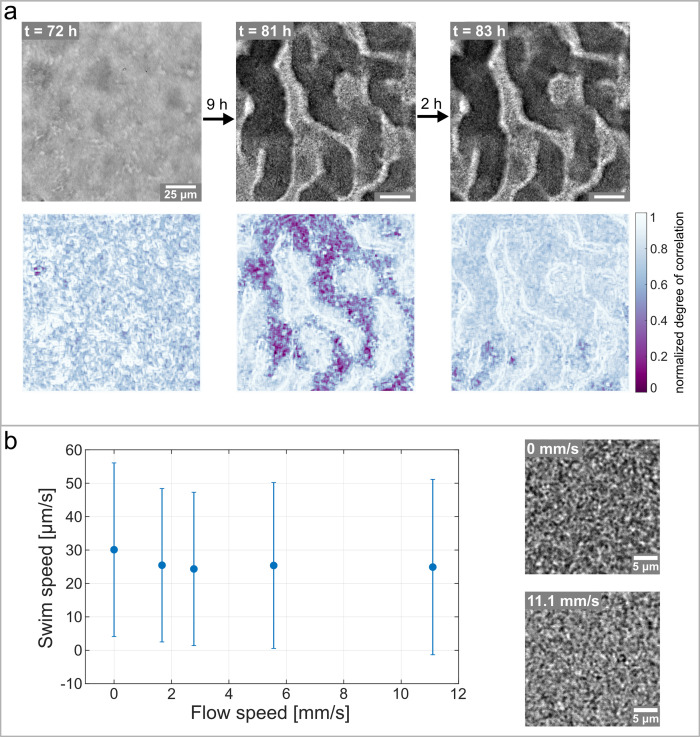
Figure 5. Hollow channels are populated by motile bacteria.
(a) Bacterial movement inside the channel network visualized using a spatially resolved, normalized degree of correlation. A low degree of correlation corresponds to an active region. The brightfield images show the corresponding structure of the biofilm. (b) Differential Dynamic Microscopy is used to quantify the bacterial swimming speed inside the biofilm channels. The swimming speed is measured at varying fluid flow speeds inside the microfluidic device. The two microscopy images show a close up of the bacterial biofilm at two different fluid flow velocities. The errorbars indicate the standard deviation from the mean swim speed. The videos of the bacteria motion can be found in Figure 5—video 2 and Figure 5—video 3.

