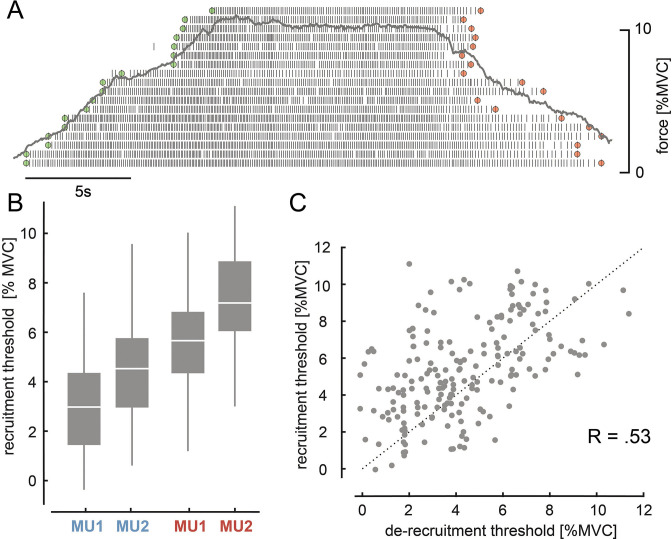
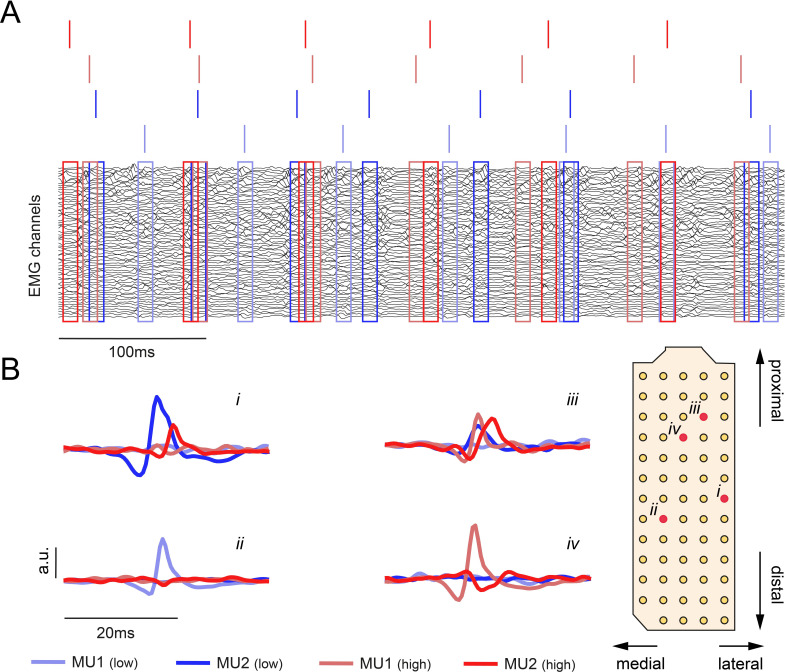
Figure 1. Motor unit (MU) recruitment and de-recruitment.
(A) The identified MU pool ranked on the recruitment order of one representative subject is shown with the underlying force profile (grey). Time points of recruitment (green) and de-recruitment (red) for each MU are marked. (B) Recruitment levels for MU1 and MU2 of the lower (blue) and higher threshold pair (red) across all subjects and days are shown with their median and quartiles. (C) Recruitment and de-recruitment threshold for the selected MUs across all days showed a significant relationship (p<0.001). Dashed line indicates the diagonal. The three subjects for whom no de-recruitment thresholds were determined were neglected in this correlation analysis.


