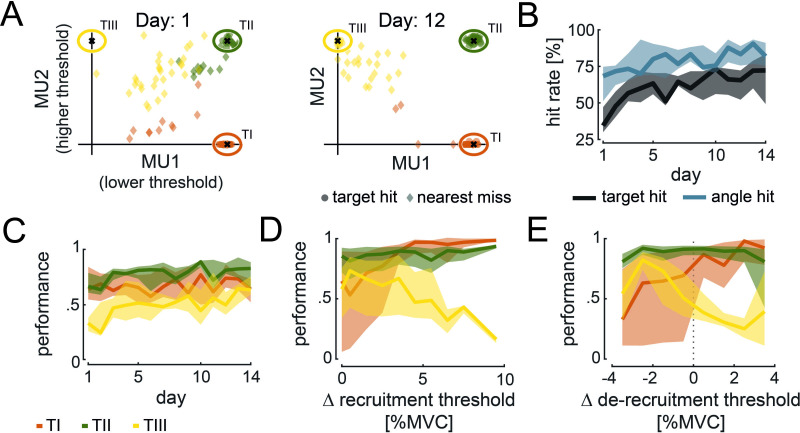
Figure 3. Cursor movement and performance during target task.
(A) Average cursor position during target hits (circle) and nearest misses (diamond) across conditions is shown for the 1st and 12th day of experiments for TI (orange), TII (green), and TIII (yellow) of one subject. (B) Target (black) and angle hit rate (blue) across subjects, conditions, and targets-of-interest are shown with their medians (solid line) and 25 and 75% quartiles (shaded areas) across days. (C) Performance values across subjects and conditions for TI (orange), TII (green), and TIII (yellow) are shown with their medians (solid line) and 25 and 75% quartiles (shaded areas) across days. (D, E) Performance values corresponding to the difference in recruitment threshold (D) and de-recruitment threshold (E) between motor unit (MU)2 and MU1 are shown across subjects and conditions for the last 5 days of training. The median (solid line) and 25 and 75% quartiles (shaded area) for TI (orange), TII (green), and TIII (yellow) are illustrated in steps of 1% maximum voluntary contraction (MVC).


