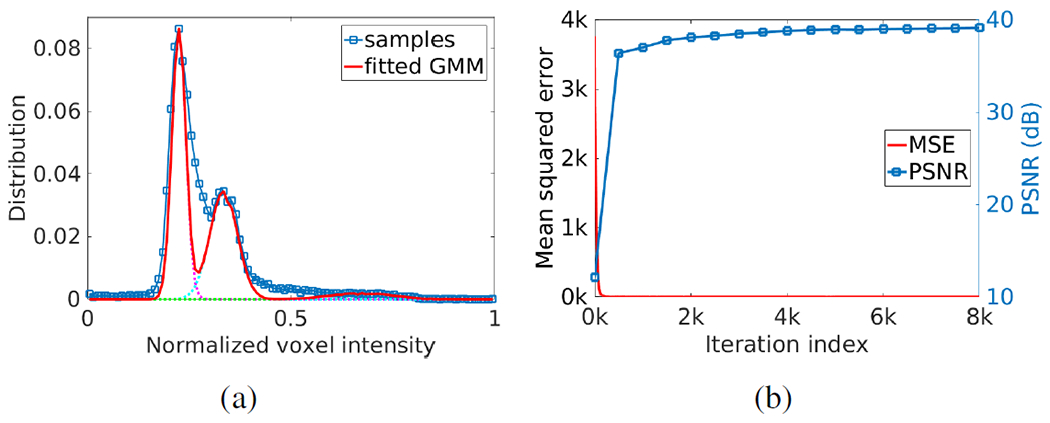
Fig. 5.

Results in example images from the HCP dataset. (a) Estimation of partial volume effect. The blue curve with markers shows the distribution of voxel intensities of a selected image region that contained CSF, GM, and WM. A Gaussian mixture model (GMM) with three components was leveraged to fit the distribution of voxel intensities, as depicted by the solid line. The three components of the GMM, represented from left to right the WM, GM, and CSF respectively, are plotted by the dashed lines. (b) Converging process of our approach in terms of mean squared error and PSNR with 8,000 iterations.
