Figure 3.

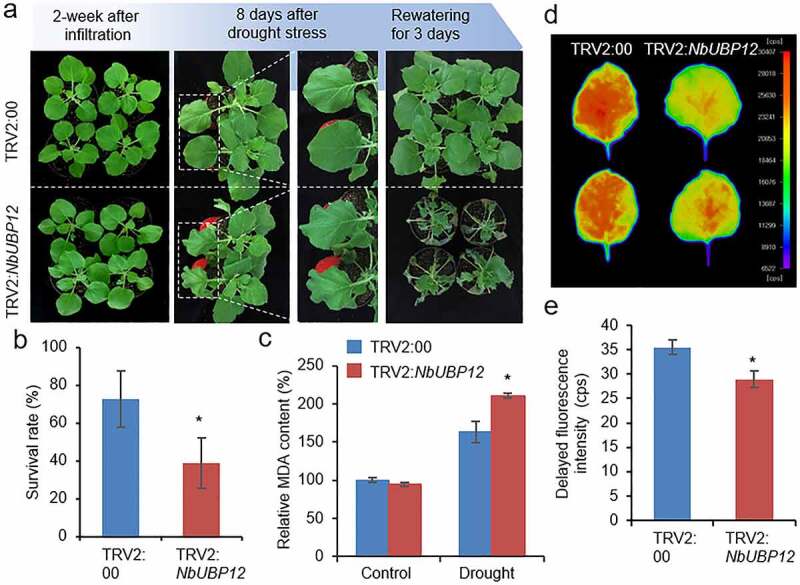
(a and b) Drought sensitivity of NbUBP12-silenced (TRV2:NbUBP12) and control (TRV2:00) plants. Two weeks after agroinfiltration, healthy plants of each line (n = 32) were subjected to drought stress by withholding watering for 13 days and rewatering for 3 days. Representative images of plants were obtained at 0 and 8 days after drought stress, and 3 days after rewatering (a), and the percentages of surviving plants were calculated (b). All data represent the means ± standard deviation of three independent experiments. (c) Measurement of malondialdehyde (MDA) in the leaves of TRV2:NbUBP12 and TRV2:00 plants treated with drought stress for 8 days. (d and e) Delayed fluorescence (DF) of the leaves of TRV2:NbUBP12 and TRV2:00 plants treated with drought stress for 8 days. Using NightShade LB 985 In vivo Plant Imaging System, representative images were obtained (d) and DF intensity was calculated (e). The closer the color is to red (high intensity), the higher the chlorophyll content. The data represent the means ± standard error of three independent experiments. Asterisks indicate significant differences between TRV2:NbUBP12 and TRV2:00 plants (Student’s t-test; *P < .05).
