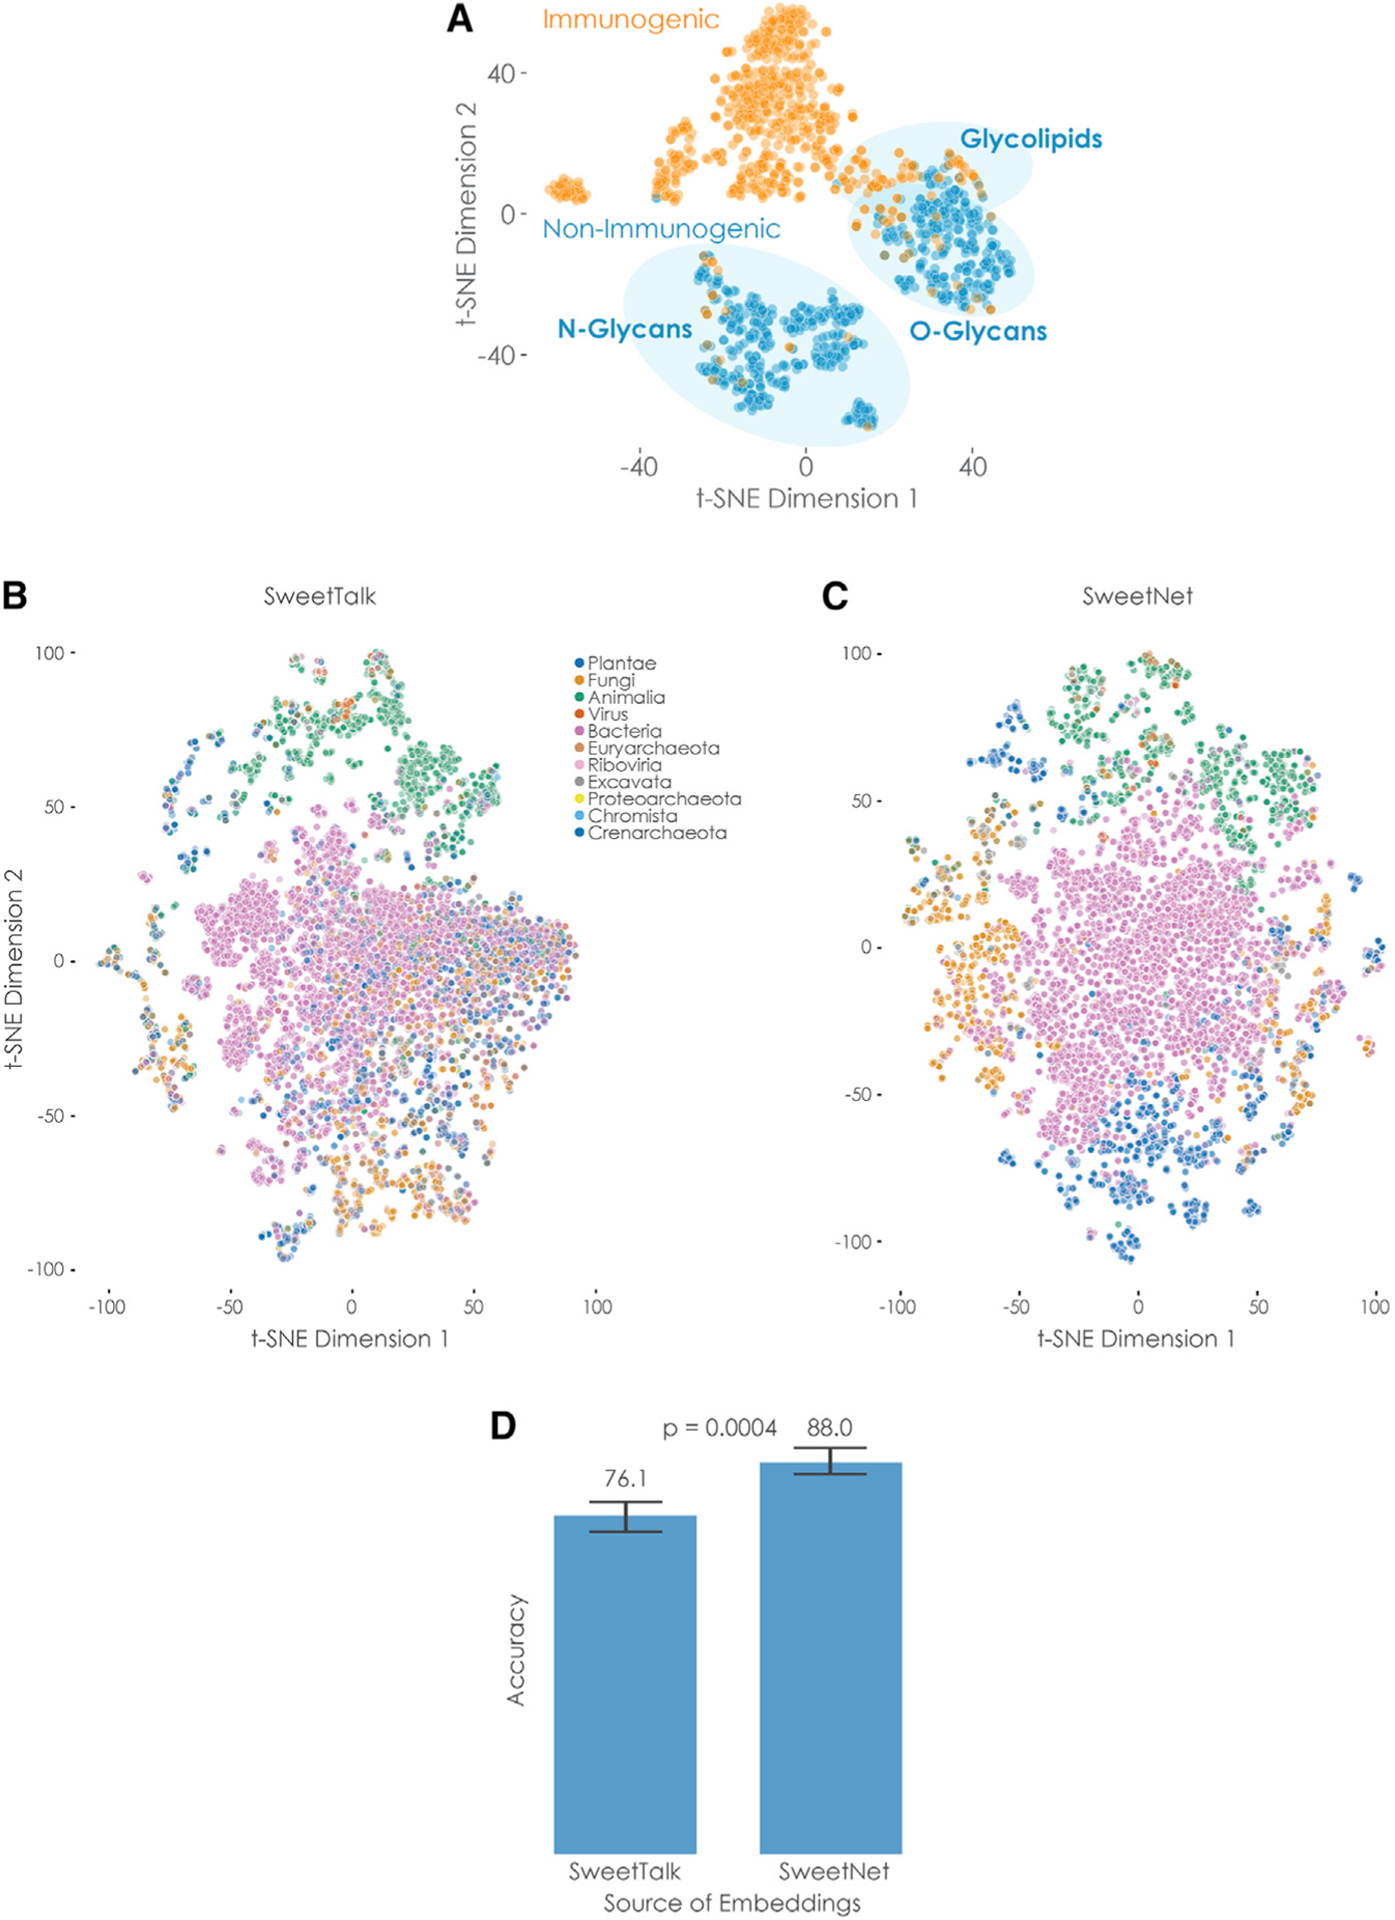
Figure 2. Comparison of glycan representations obtained by machine learning.

(A) Immunogenic glycan representations learned by SweetNet. Glycan representations for all glycans with immunogenic information were extracted from a trained SweetNet-based model and are shown via t-distributed stochastic neighbor embedding (t-SNE; van der Maaten and Hinton, 2008), colored by their immunogenicity label, and annotated by glycan classes.
(B and C) Taxonomic glycan representations learned by SweetTalk and SweetNet. Glycan representations for all glycans with taxonomic information in our dataset were generated by SweetTalk (B) and SweetNet (C) trained on predicting the taxonomic genus a given glycan stemmed from. These representations are shown via t-SNE and are colored by their taxonomic kingdom.
(D) Comparing information value of representations obtained by SweetTalk and SweetNet. Logistic regression models were trained on the representations obtained from the genus-level SweetTalk and SweetNet models in order to predict the taxonomic kingdom of a glycan. The achieved accuracy from representations from five training runs is shown here and was compared between models by a Welch’s t test (n per group = 5).
See also Figures S3 and S4.
