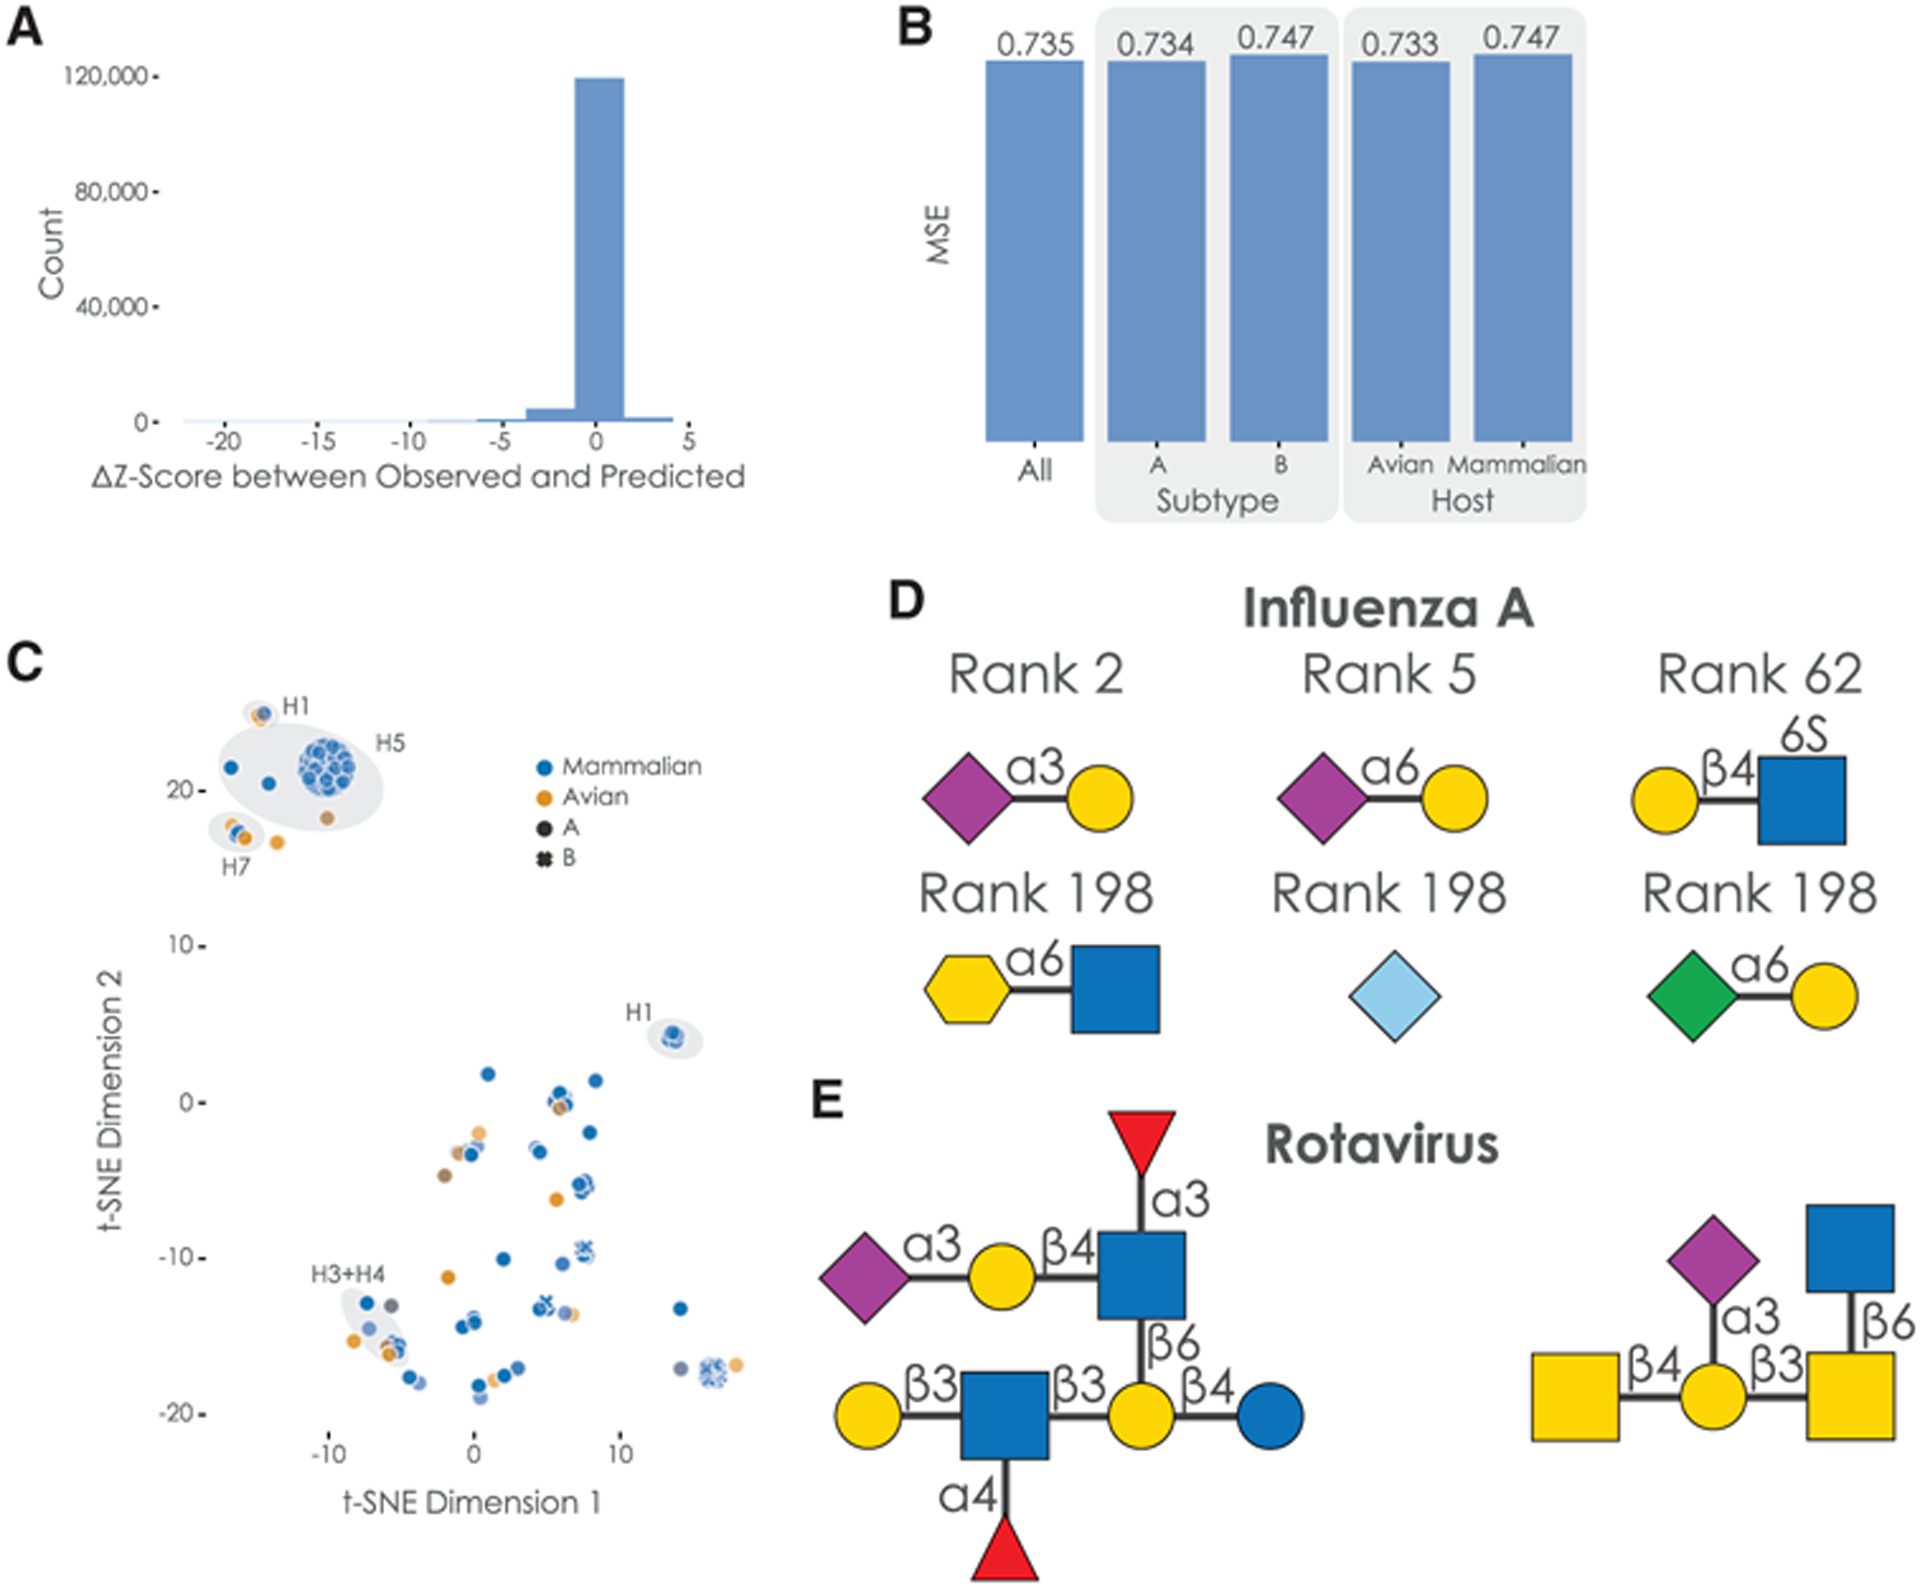
Figure 4. Characterizing the SweetNet-based model predicting virus-glycan binding.

(A) Distribution of residuals between predicted and observed Z scores. We calculated the difference between all observed and predicted Z scores of hemagglutinin-glycan binding interactions, shown here as a histogram.
(B) Analyzing model performance on subgroups in the data. We obtained the mean square error (MSE) of our trained model for subgroups such as virus subtype or host organism in our data.
(C) Hemagglutinin representations learned by the protein-analyzing module of the model. We obtained the representation learned by our protein-analysis module from the last state of our LSTM for all 339 unique protein sequences in our dataset. These representations are shown via t-SNE and colored/marked by their host organisms and virus subtype, respectively. Clusters of hemagglutinin subtypes are further annotated.
(D) Examples of glycan motifs relevant for the prediction of hemagglutinin-glycan binding by SweetNet-based models. Some of the glycan motifs that were significantly relevant for prediction are shown in the symbol nomenclature for glycans (SNFG), together with their median rank across host species.
(E) Examples of glycans with high predicted binding to rotavirus.
