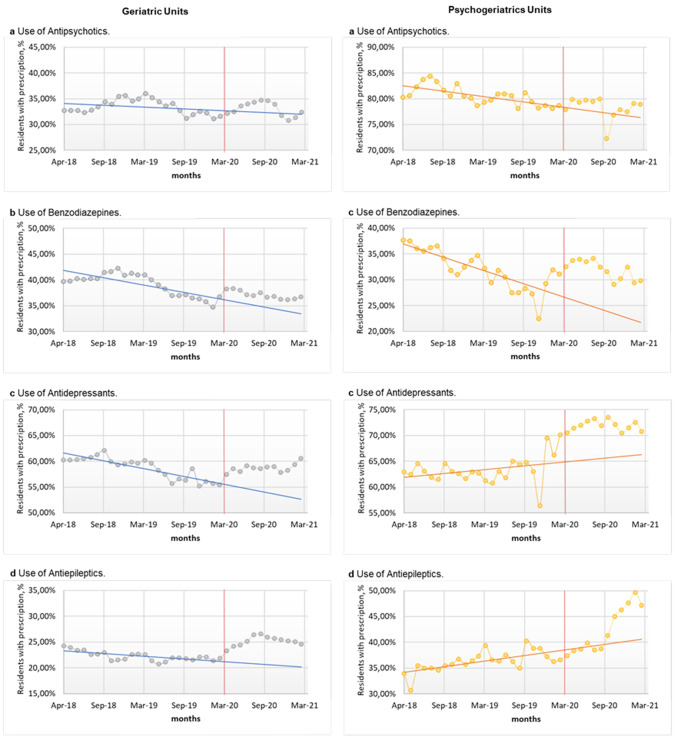
Fig. 1.
Changes in the prescription of psychotropic drugs in nursing homes from April 2018 to March 2021. Representation by the treatment sub-groups of the monthly proportion of residents taking some psychotropic drug from April 2018 to March 2021, in the different residential units (geriatric unit, psychogeriatric unit). The vertical dotted red line represents the date that coronavirus disease 2019 appeared in the Basque Country (March 2020). The secular trend lines are based on consumption proportions from April 2018 to March 2020

