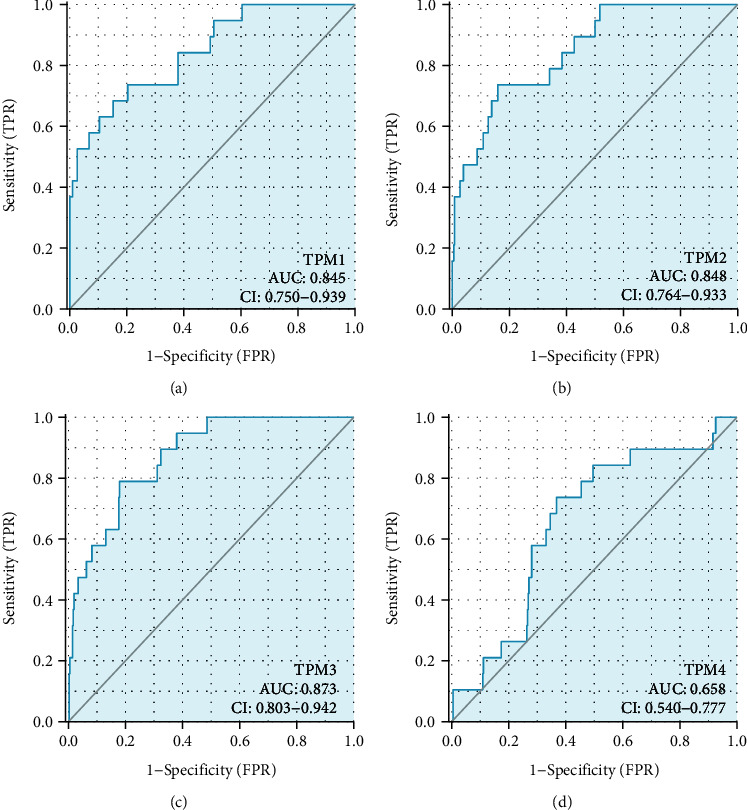
Figure 2.

ROC curve analysis of TM prediction of bladder cancer. (a) ROC curve showed the efficacy of TPM1 expression level in distinguishing bladder cancer tissue from nontumor tissue. (b) ROC curve showed the efficacy of TPM2 expression level in distinguishing bladder cancer tissue from nontumor tissue. (c) ROC curve showed the efficacy of TPM3 expression level in distinguishing bladder cancer tissue from nontumor tissue. (d) ROC curve showed the efficacy of TPM4 expression level in distinguishing bladder cancer tissue from nontumor tissue.
