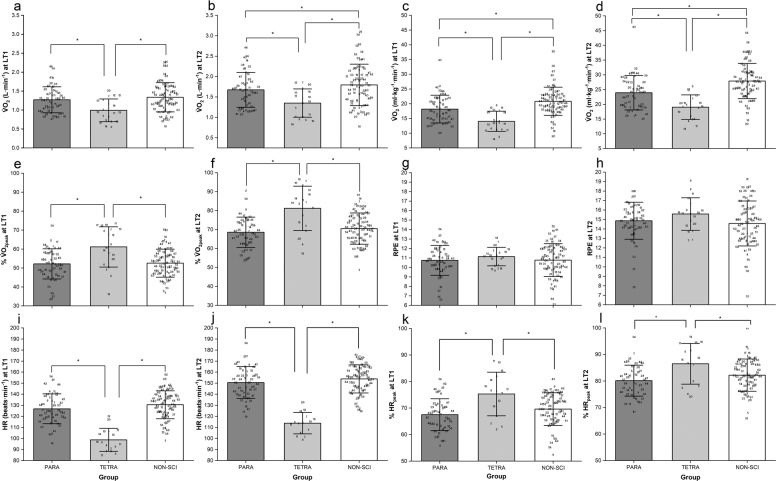
Fig. 1. Group physiological responses at lactate thresholds.
a Absolute V̇O2 at LT1. b Absolute V̇O2 at LT2. c Relative V̇O2 at LT1. d Relative V̇O2 at LT2. e %V̇O2peak at LT1. f %V̇O2peak at LT2. g RPE at LT1. h RPE at LT2. i HR at LT1. j HR at LT2. k %HRpeak at LT1. l %HRpeak at LT2. Data are presented at mean (SD) with individual points overlaid. Within each group, numbers refer to the same participant in each figure. Asterisk (*) indicates significantly greater than the identified group, P < 0.05.

