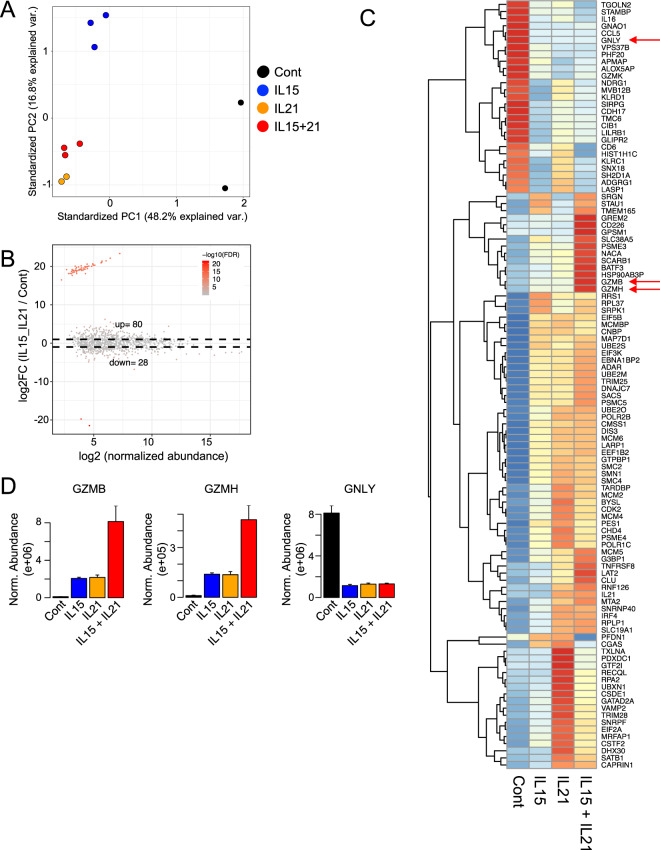
Fig. 5. Mass spectrometry revealed protein profiles in NK-EVs.
A Principal component analysis of mass spectrometry data of EVs derived from NK-92 cells stimulated with IL-15, IL-21, IL-15 + IL-21, or without any cytokines. Duplicate samples were analyzed for no cytokine (control) and IL-21 and triplicate samples for IL-15 and IL-15 + IL-21. B MA plot (plot of log-fold changes (M values) versus mean normalized expression (A values) of differentially expressed proteins in NK-EVs derived from NK-92 cells stimulated with IL-15 + IL-21 or without any cytokines. C Heat map of differentially expressed proteins based on FC > 2 and FDR < 0.05 in NK-EVs stimulated with IL-15, IL-21, IL-15 + IL-21, or without any cytokines. D The abundance of GZMB, GZMH, and GNLY in NK-EVs derived from NK-92 cells. Data are shown as means + SEM of triplicate or duplicate independent samples analyzed by mass spectrometry.

