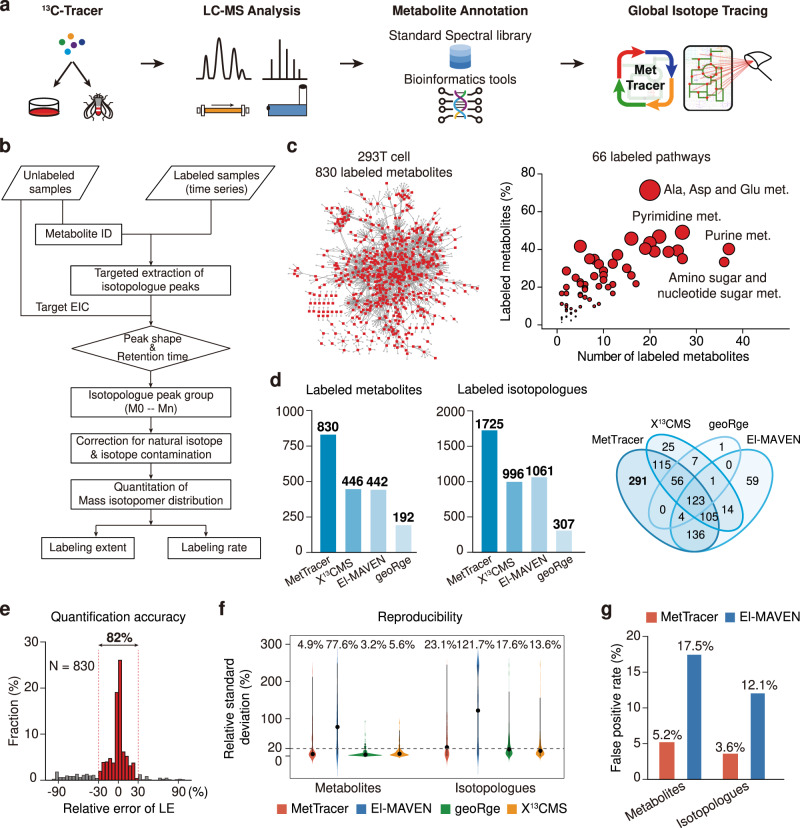
Fig. 1. Global stable-isotope tracing metabolomics.
a Schematic illustration of MetTracer workflow. b Detailed data processing workflow in MetTracer. c Distributions of the 830 labeled metabolites in 293T cells in the metabolic network (left panel) and pathways (right panel). Red dots in the left panel represent the labeled metabolites. The circle size in the right panel represents the ratio of the number of labeled metabolites to the number of metabolites in a pathway. d Numbers of labeled metabolites and isotopologues using MetTracer and other indicated software tools. The Venn diagram shows the overlap of the labeled metabolites using MetTracer and other software. e Distribution of relative errors of labeling extent values between MetTracer and manual analysis using Skyline (n = 830 metabolites). f Relative standard deviation (RSD) distributions of metabolites and isotopologues obtained from MetTracer and other software tools (n = 6 technical replicates of 293T cell samples). The black dots represent median RSD. g False-positive rates of the labeled metabolites and isotopologues obtained from MetTracer and El-MAVEN. Source data are provided as a Source Data file.

