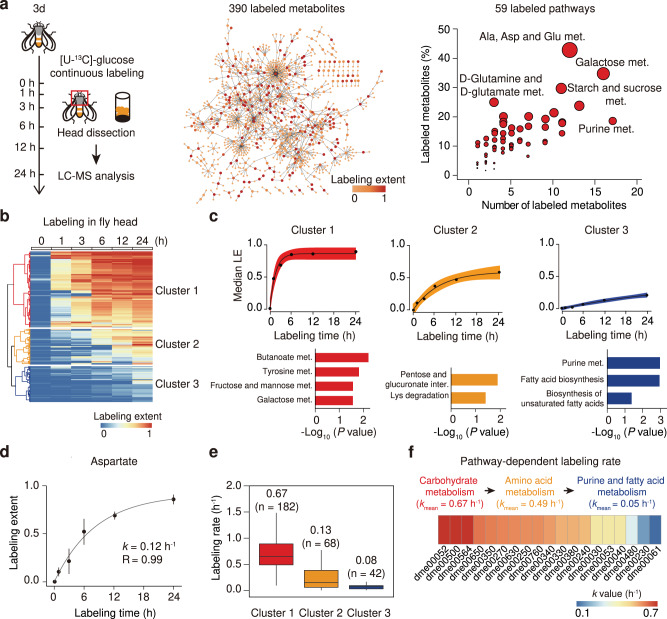
Fig. 2. In vivo stable-isotope tracing of the metabolome in Drosophila.
a Illustration of in vivo stable-isotope tracing in Drosophila and the distribution of 390 labeled metabolites from 59 pathways in head tissues. b Hierarchical-clustering analysis of the labeled metabolites (n = 390). c Upper panels, labeling dynamics of metabolites in each cluster; black dots represent the median labeling extent (LE) values of metabolites in the cluster; black lines represent the fitted metabolic dynamics; error bands represent 95% confidence intervals. Bottom panels, enriched pathways in each cluster (p-values < 0.05; hypergeometric test). d The example of aspartate for the calculation of labeling rate k (n = 10 biological replicates in each time point); black dot represents median LE; whiskers represent ±s.d. e k-value distributions for metabolites in three clusters (n = 182, 68, 42 fitted metabolites in clusters 1, 2, and 3, respectively). The centerlines of the boxplots indicate the median values, the lower and upper lines in boxplots correspond to 25th and 75th quartiles, and the whiskers indicate the largest and lowest points inside the range defined by 1st and 3rd quartile plus 1.5 times interquartile ranges (IQR). f Heat map showing the mean k-values of metabolties from 19 significantly labeled pathways. Pathway names are provided in Supplementary Table 5. Source data are provided as a Source Data file.

