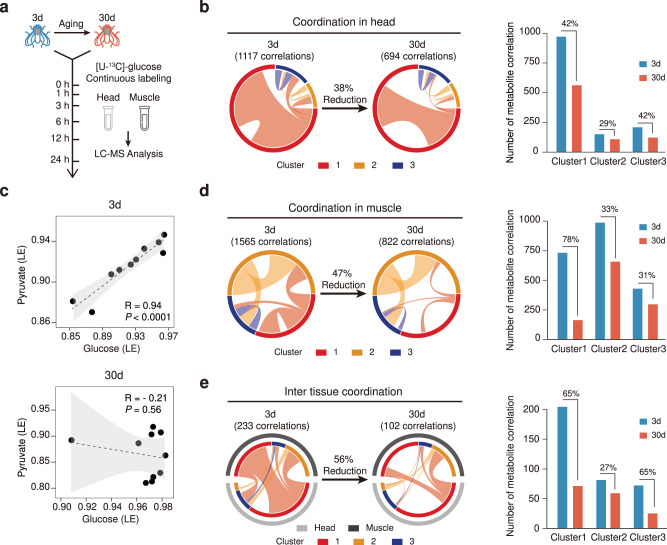
Fig. 4. System-wide alternations of metabolic homeostasis in Drosophila during aging.
a The in vivo isotope tracing metabolomics of young (3d) and old (30d) Drosophila. b Left, a Circos plot showing metabolite–metabolite correlations in young and old Drosophila head tissues. Right, a bar plot showing the numbers of metabolite–metabolite correlations in each metabolite cluster. c Correlation of labeling extents for the labeled glucose and pyruvate during aging (n = 10 biological replitates in each group). Dashed line, linear regression; gray shadow, 95% confidence interval of the linear relationship between pyruvate and glucose. The p-value of Pearson correlation coefficient was calculated by two-sided Student’s t-test. d Left, a Circos plot showing metabolite–metabolite correlations in young and old Drosophila muscle tissues. Right, a bar plot showing the numbers of metabolite–metabolite correlations in each metabolite cluster. e Left, a Circos plot showing metabolite–metabolite correlations between head and muscle tissues in young and old Drosophila. Right, a bar plot showing the numbers of metabolite–metabolite correlations in each metabolite cluster. In panels b, d, e, the colored circle refers to the labeling rate cluster. Clusters 1–3 represent the labeling rate clusters in Figs. 2 and 3. Ribbon connecting metabolite clusters refers to the significant correlations between metabolites. Ribbon thickness refers to the number of significant metabolite-to-metabolite correlations. Source data are provided as a Source Data file.

