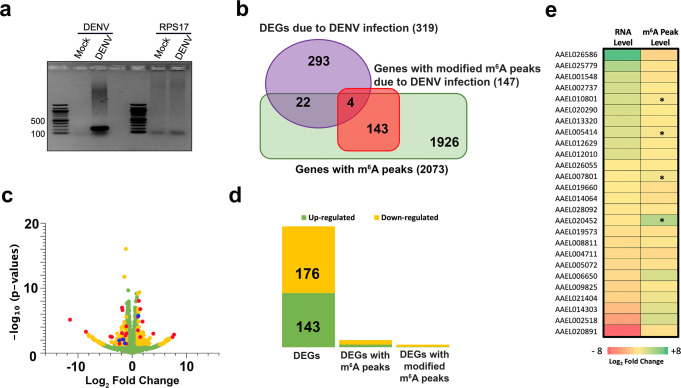
Fig. 3. Dengue virus infection alters m6A modification of Ae. aegypti transcripts.
a Confirmation of DENV infection of Aag2 cells. RT-PCR analysis of RNA extracted from Aag2 (Mock) and Aag2 cells infected with 1 MOI DENV 5 days after infection using DENV-specific and RPS17 (control) primers. The PCR products were analysed on an agarose gel. b Venn diagram showing summarized numbers of differentially expressed genes, with and without m6A peak changes. c Volcano plot showing differentially expressed genes in Aag2 cells in response to DENV infection. Green and yellow dots represent up-regulated and down-regulated genes with fold change >2 and p value <0.05, and those in red and blue are DEGs with m6A peaks, with the blue ones being DEGs with changed m6A peaks upon DENV infection. d Number of significantly differentially expressed genes between mock and DENV-infected Aag2 cells at five days post infection among which there were 26 with m6A peaks, of which four showed modified m6A upon DENV infection. e Heatmap of Ae. aegypti genes with m6A sites, which were differentially expressed in response to DENV infection (see Table 1 for the list of genes). The four genes that showed differential m6A and gene expression upon DENV infection are indicated by asterisks.

