Figure 4.
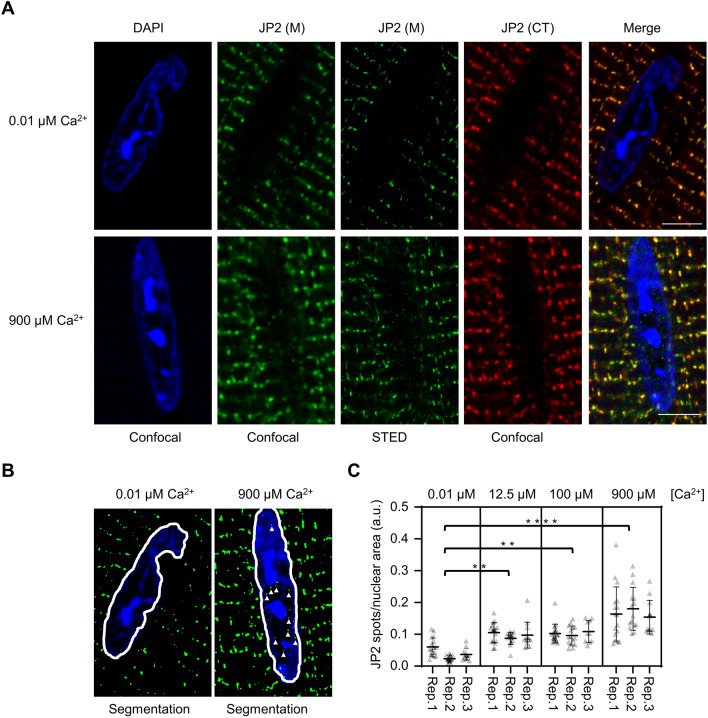
Micromolar extracellular Ca2+ concentrations increase the number of intranuclear JP2 signal spots in living ionomycin-permeabilized mouse cardiomyocytes. (A) Confocal and STED images showing DAPI-stained intranuclear DNA-rich regions and JP2 co-immunofluorescence M and CT signals. Following the ionomycin (2 µM) induced exposure to a 900 µM high extracellular Ca2+ concentration for 2 h, the antibody against the middle (M) JP2 portion robustly detected an increased number of small intranuclear JP2 signal spots, each visualized (green) by confocal and confirmed by STED imaging (compare 0.01 µM versus 900 µM). However, confocal imaging with the C-terminal JP2 antibody (CT) excluded any intranuclear signals (red). As expected, both the JP2 M and CT epitope-specific antibodies robustly detected the large cytosolic cluster signals with the typical striated pattern in cardiomyocytes (positive control). Scale bars, 5 μm. (B) Representative STED image segmentation examples for counting of the intranuclear number of JP2 signal spots labeled with the antibody against the M epitope (green). White triangles identify very small intranuclear JP2 signal spots in proximity but not colocalized with DNA-rich densely DAPI-labeled signal regions in central nuclear imaging planes suggesting not hetero- but euchromatic localization of intranuclear JP2. Apparently, the number of intranuclear JP2 signal spots is increased after exposure to the 900 µM extracellular Ca2+ concentration. Same magnification as A. (C) Dot plot quantifiying intranuclear JP2 signal spots normalized to the intranuclear STED imaging area in living cardiomyocytes exposed to increasing extracellular Ca2+ concentrations at 37 °C. Cultured ventricular cardiomyocytes were permeabilized with 2 µM ionomycin in culture for 2 h at 37 °C. Each Ca2+ concentration was analyzed in triplicate based on 3 biological replicates and at least 15 cardiomyocytes per group (please refer to the methods section for details). Data are presented as mean ± SD. Differences between groups were assessed by nested one-way ANOVA. **p < 0.01; ****p< 0.0001.

