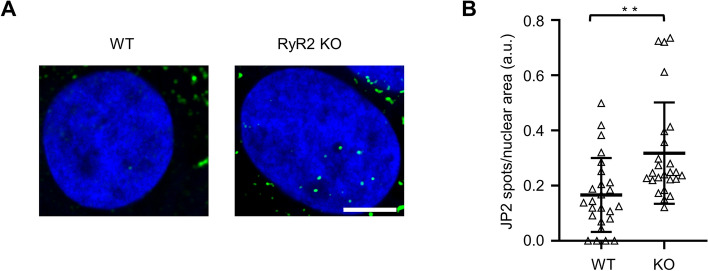
Figure 7.
RyR2 knockout increases the number of discrete intranuclear JP2 signal spots in 2 months matured hiPSC-CMs. (A) Confocal images showing the DAPI-stained central nuclear imaging sections of WT versus RyR2 knockout hiPSC-CMs. Whereas one JP2 M epitope-labeled signal spot was apparent inside the WT hiPSC-CM nucleus, the number of signal spots was increased in RyR2 knockout hiPSC-CMs. Scale bar, 5 μm. (B) Dot plot comparing the intranuclear area-normalized number of JP2 signal spots between WT and RyR2 KO hiPSC-CMs. Data are represented as mean ± SD; n = 25 cells per group. Student’s t-test; **p < 0.01.

