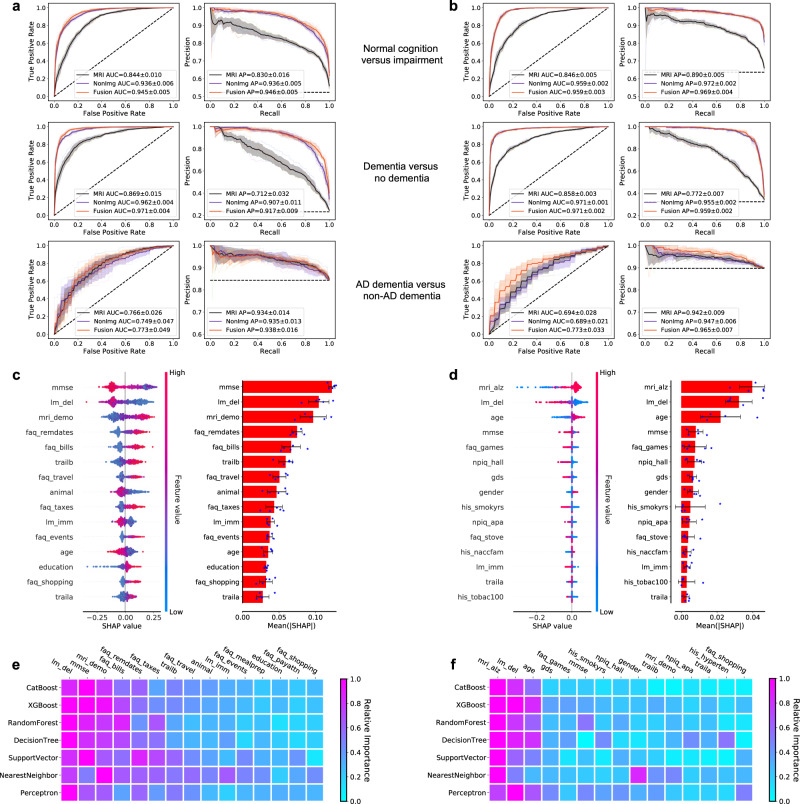
Fig. 3. Performance of the deep learning models.
a, b ROC curves showing true positive rate versus false positive rate and PR curves showing the positive predictive value versus sensitivity on the a NACC test set and b OASIS dataset. The first row in a and b denotes the performance of the MRI-only model, the non-imaging model, and the fusion model (CNN + CatBoost) trained to classify cases with NC from those without NC (COGNC task). The second row shows ROC and PR curves of the MRI-only model, the non-imaging model, and the fusion model for the COGDE task aimed at distinguishing cases with DE from those who do not have DE. The third row illustrates performance of the MRI-only model, the non-imaging model, and the fusion model focused on discriminating AD from nADD. For each curve, mean AUC was computed. In each plot, the mean ROC/PR curve and standard deviation are shown as bolded lines and shaded regions, respectively. The dotted lines in each plot indicate the classifier with the random performance level. c, d Fifteen features with highest mean absolute SHAP values from the fusion model are shown for the COG and ADD tasks, respectively across cross-validation rounds (n = 5). Error bars overlaid on bar plots are centered at the mean of the data and extend + /− one standard deviation. For each task, the MRI scans, demographic information, medical history, functional assessments, and neuropsychological test results were used as inputs to the deep learning model. The left plots in c and d illustrate the distribution of SHAP values and the right plots show the mean absolute SHAP values. All the plots in c and d are organized in decreasing order of mean absolute SHAP values. e, f For comparison, we also constructed traditional machine learning models to predict cognitive status and AD status using the same set of features used for the deep learning model, and the results are presented in e and f, respectively. The heat maps show fifteen features with the highest mean absolute SHAP values obtained for each model. Source data are provided as a Source Data file.

