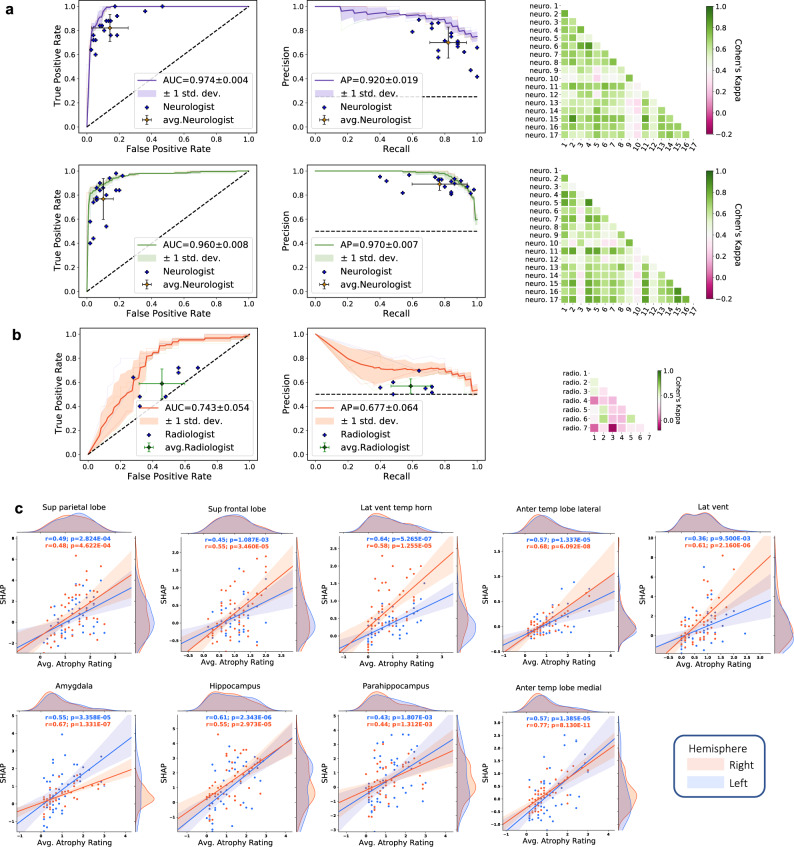
Fig. 6. Expert-level validation.
a For the COGNC task (Row 1), the diagnostic accuracy of board-certified neurologists (n = 17) is compared to the performance of our deep learning model using a random subset of cases from the NACC dataset (n = 100). Metrics from individual clinicians are plotted in relation to the ROC and PR curves from the trained model. Individual clinician performance is indicated by the blue plus symbol and averaged clinician performance along with error bars is indicated by the green plus symbol on both the ROC and PR curves. The mean ROC/PR curve and the standard deviation are shown as the bold line and shaded region, respectively. A heatmap of pairwise Cohen’s kappa statistic is also displayed to demonstrate inter-rater agreement across the clinician cohort. For the COGDE task (Row 2), ROC, PR, and interrater agreement graphics are illustrated with comparison to board-certified neurologists in identical fashion. For these tasks, all neurologists were granted access to multimodal patient data, including MRIs, demographics, medical history, functional assessments, and neuropsychological testing. The same data was used as input to train the deep learning model. b For validation of our ADD task, a random subset (n = 50) of cases with dementia from the NACC cohort was provided to the team of neuroradiologists (n = 7), who classified AD versus those with dementia due to other etiologies (nADD). As above, the diagnostic accuracy of the physician cohort is compared to model performance using ROC and PR curves. Graphical conventions for visualizing model and clinician performance are as described above in a and, once more, pairwise Cohen’s kappa values are shown to demonstrate inter-rater agreement. c SHAP values from the second convolutional layer averaged from selected brain regions are shown plotted against atrophy scores assigned by neuroradiologists. Orange and blue points (and along with regression lines and 95% confidence intervals) represent left and right hemispheres, respectively. Spearman correlation coefficients and corresponding two-tailed p values are also shown and demonstrate a statistically significant proportionality between SHAP scores, and the severity of regional atrophy assigned by clinicians. Source data are provided as a Source Data file.

