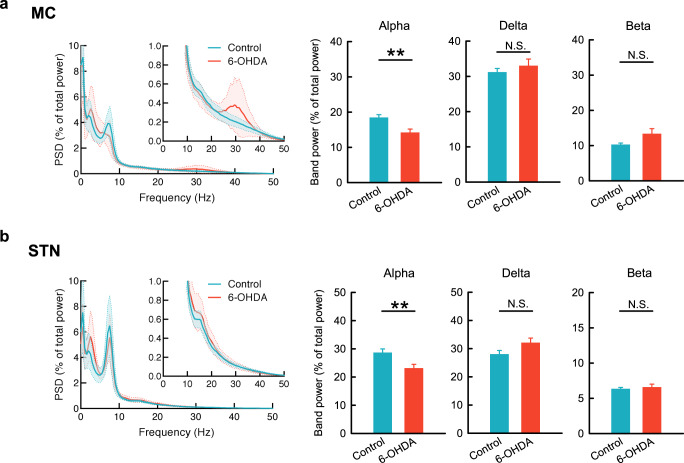
Fig. 1. The basic rhythms of MC and STN in control and parkinsonian rats.
The average PSD spectra of 29 and 20 continuous 5-min LFP recordings from 10 control (blue) and 11 parkinsonian (6-OHDA, red) rats, respectively. The open field test (OFT) reveals a significantly higher peak in the α band (7–10 Hz) in control than in parkinsonian rats in both MC (a) and STN (b). Meanwhile, there is a lower δ band (1–4 Hz) power in both MC and STN in control than in parkinsonian rats, although the differences are statistically insignificant. In contrast, a peak oscillation in β band (20–40 Hz) in parkinsonian but not in control rats is noted only in MC. PSD spectra were presented as mean (solid curves) ± standard deviation (shaded areas). Data in the bar plots were presented as mean ± standard error of mean (S.E.M.). Data were analyzed with Mann–Whitney U tests. **p < 0.01, N.S., nonsignificant.

