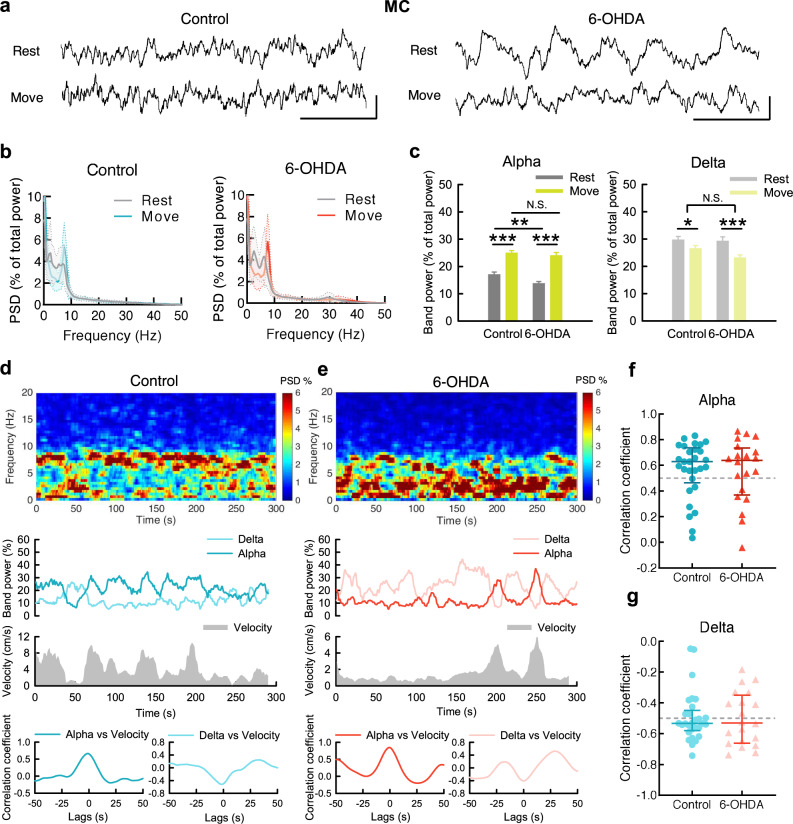
Fig. 2. The changes of MC rhythms upon movement in control and parkinsonian rats.
a Sample MC LFP recordings during rest and movement from a control rat (left) and a parkinsonian rat (6-OHDA, right). Scale bar represents 500 ms/100μV. b Average PSD spectra in MC during 10-s continuous rest or movement show a marked increase of α power and decrease of δ power from rest to movement in both control and parkinsonian rats (n = 52 and 50 matched segments of rest and movement from 10 control and 11 parkinsonian rats, respectively). c Band power analysis from part b. d, e Power spectrograms (top) and the temporal changes of MC α and δ band powers (middle, upper) as well as concomitant moving velocities (middle, lower) from a sample 5-min recording in OFT in control (d) and in parkinsonian rats (e). Cross-covariance analysis between time-varying band power and moving velocity reveals an evident peak of correlation coefficient at zero time lag in α band (bottom, left), but a valley in δ band (bottom, right) in control and parkinsonian rats. Each series of data contain one data point per second (300 data points in total). f Cross-covariance analysis from all 5-min recordings shows that most of control and parkinsonian rats have a strong correlation coefficient (>0.5) between MC α power and moving velocity at zero time lags. Correlation coefficient >0.5: control = 21/29 (72%), parkinsonian = 14/20 (70%); median of correlation coefficient, control: 0.63, parkinsonian: 0.64. g Similar analysis to that in (f) shows no positive but negative correlation between δ power and moving velocity. Correlation coefficient < −0.5: control = 19/29 (66%), parkinsonian = 11/20 (55%); median of correlation coefficient, control: −0.53, parkinsonian: −0.53). PSD spectra were presented as mean (solid curves) ± standard deviation (shaded areas). Data in bar plot were presented as mean ± S.E.M. Data in (c) were analyzed with 2 × 2 mixed model ANOVA and simple main effect tests for pairwise comparison. Each horizontal line reports the simple main effect, and the square bracket reports the main effect of control vs. 6-OHDA in ANOVA. *p < 0.05, **p < 0.01, ***p < 0.001, N.S., nonsignificant.

