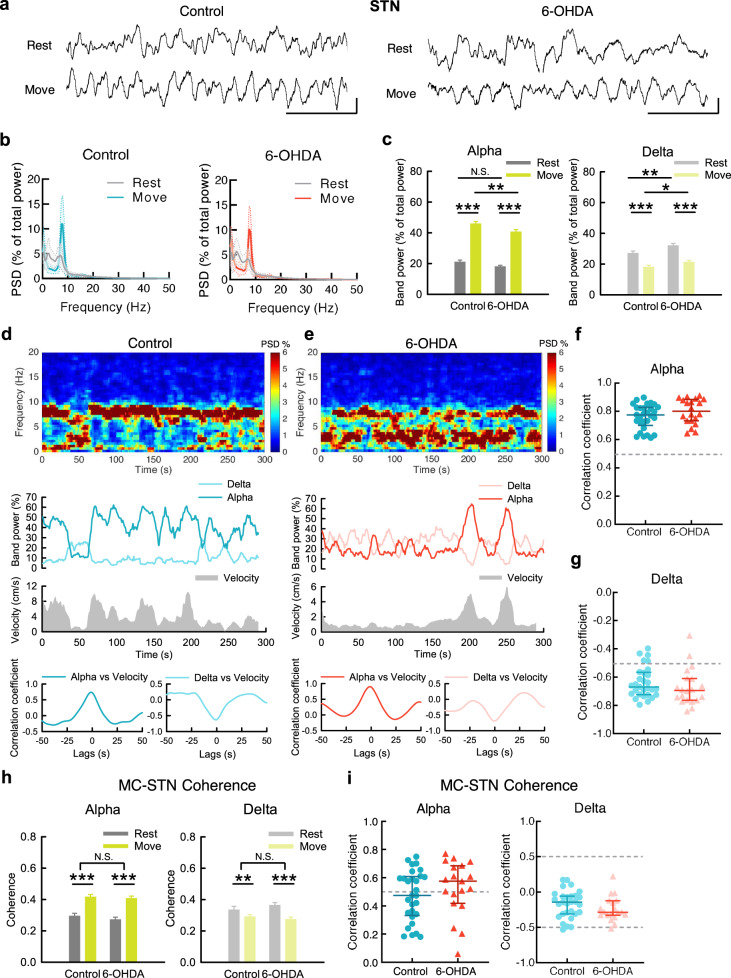
Fig. 3. The changes of STN rhythms upon movement in control and parkinsonian rats.
a–g Similar experiments and analyses to those in Fig. 2 were done on STN. 52 and 50 matched segments of rest and movement were analyzed for control and parkinsonian rats, respectively. Band power analysis reveals significant increase of α power and decrease of δ power from rest to movement in both control and parkinsonian rats (c). Correlation coefficient > 0.5: control = 29/29 (100%), parkinsonian = 20/20 (100%); median of correlation coefficient, control: 0.78, parkinsonian: 0.8, between STN α power and moving velocity at zero time lags (f). Correlation coefficient < −0.5: control = 25/29 (86%), parkinsonian = 18/20 (90%); median of correlation coefficient, control: −0.66, parkinsonian: −0.68, between STN δ power and moving velocity (g). Scale bar represents 500 ms/100μV. h Average MC-STN coherence in α band reveals a significant increase from rest to movement in both control and parkinsonian rats, accompanied by a decrease of δ coherence in parkinsonian rats. Either α or δ coherence shows no difference between control and 6-OHDA rats. i Most control and parkinsonian rats show a positive correlation, or even a strong positive correlation, coefficient between α coherence and moving velocity in cross-covariance analysis (correlation coefficient >0.5: control: 14/29, parkinsonian: 14/20, median of correlation coefficient, control: 0.47, parkinsonian: 0.55). In contrast, almost all of the control and parkinsonian rats show no strong correlation between MC-STN δ coherence and moving velocity (correlation coefficient < −0.5: control: 1/29, parkinsonian: 1/20; median of correlation coefficient, control: −0.14, parkinsonian: −0.28). PSD spectra were presented as mean (solid curves) ± standard deviation (shaded areas). Data in bar plot were presented as mean ± S.E.M. Data in (c) and (h) were analyzed with 2 × 2 mixed model ANOVA and simple main effect tests for pairwise comparison. Each horizontal line reports the simple main effect, and each square bracket reports the main effect of control vs. 6-OHDA in ANOVA. *p < 0.05, **p < 0.01, ***p < 0.001, N.S., nonsignificant.

