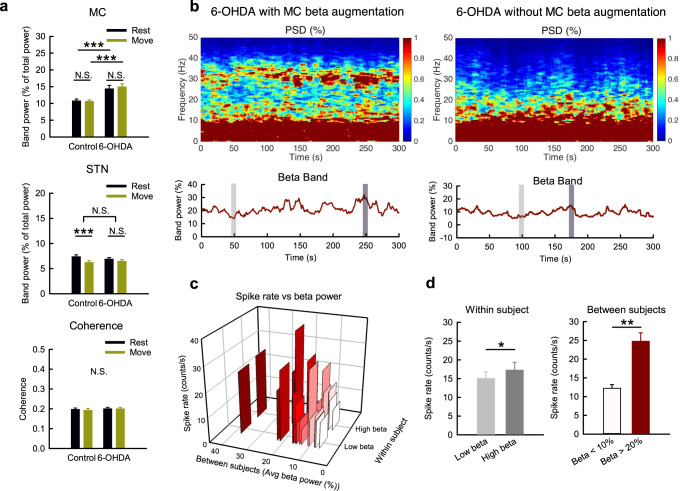
Fig. 4. The association of MC β augmentation with higher spike activities but not locomotor activities in parkinsonian rats.
a β band power analysis from the 10-s segments in Figs. 2, 3 (n = 52 and 50 matched segments of rest and movement from 10 control and 11 parkinsonian rats, respectively). b–d Power spectrograms (tops) and the temporal changes of MC β band powers (bottoms) from sample recordings demonstrate the typical presentation of parkinsonian rats with MC β augmentation or not (b, left and right, respectively). Among the 20 continuous 5-min recordings from 11 parkinsonian rats, a peak in β range frequency was noted in 9 recordings (45%) but not in the other 11 recordings (55%). Each recording was further divided into two 10-s segments, with highest (dark gray bar) or lowest (light gray bar) β band power, as the high β group (“High beta”) and low β group (“Low beta”), respectively, for multi-unit analysis. The 3D-bar plot reveals average spike rates from 7 leads grouping according to the level of β power in each recordings of parkinsonian rats, and shows that higher β power is associated with a higher spike rate in both within-subject comparison and between-subject comparison (c). There is a significant higher MC MU spike rate in “High beta” group than in “Low beta" group (n = 17 from 8 parkinsonian rats) (d, left). There is also a higher spike rate in recordings with extreme β augmentation (average β power > 20%) than in recordings with scarcity of β (average β power < 10%), n = 4 from 2 rats in both groups (each group had n = 8 segments from “High beta” and “Low beta” groups) (d, right). Data were presented as mean ± S.E.M. Data in (a) were analyzed with 2 × 2 mixed model ANOVA and simple main effect tests for pairwise comparison. Each horizontal line reports the simple main effect, and each square bracket reports the main effect of control vs. 6-OHDA in ANOVA. The data in the right and left panels in (d) were analyzed with Mann–Whitney U tests and Wilcoxon signed-rank tests, respectively. *p < 0.05, **p < 0.01, ***p < 0.001, N.S., nonsignificant.

