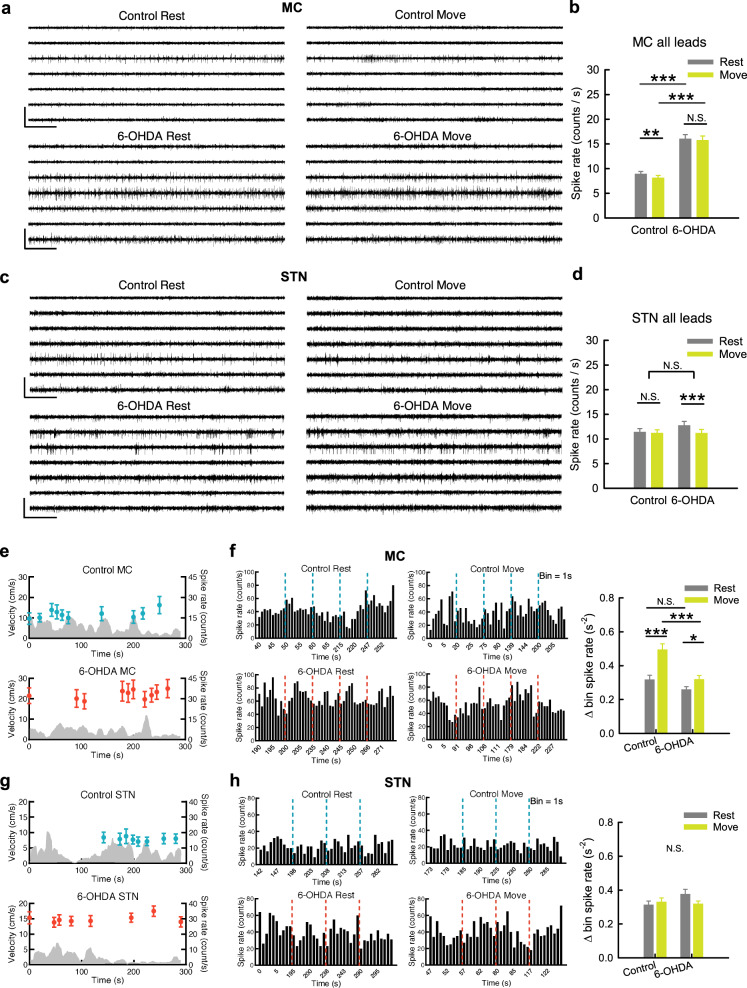
Fig. 5. Higher overall rates and less time-dependent changes of MC multi-unit activities associated with movement in parkinsonian rats.
a Sample sweeps of multi-unit (MU) recordings from 7-lead arrays in MC from a control (top) and a parkinsonian rat (6-OHDA, bottom). b The average MU spike rates in MC are significantly higher in parkinsonian than control rats. n = 364 and 350 (52 and 50 segments × 7 leads) rest and movement pairs from 10 control and 11 parkinsonian rats, respectively. c, d Similar experiments and analyses to (a) and (b) were done on STN. n = 364 and 350 pairs in control and parkinsonian rats, respectively. e The temporal profiles of the average MC MU spike rates in a single OFT trial in one control (blue dots) and one parkinsonian rat (red dots) from the same leads in (a) reveal no correlation with the moving speed (gray areas) in both cases (each point of the spike rate is plotted at the center of time of a segment in the OFT trial, and represents the average spike rate of the 7 leads in a segment). f Rate histograms from one sample lead from all segments in (e) reveal apparently more changes in MC spike rates between adjacent bins from rest to move in control (left panel, upper) than in parkinsonian rats (left panel, lower). The average bin spike rate change (bin = 1 s) in all sampled segments. n = 35 (5 segments × 7 leads) rest and movement pairs from one control rat and one parkinsonian rat, respectively. g, h Similar experiments and analyses to (e) and (f) were done on STN. n = 24 and 28 pairs in control and parkinsonian rat, respectively. #One lead in the sample control STN segments was excluded from statistics due to the extraordinarily low spike rate (<1 Hz). Scale bars represent 500 ms/500μV. Data were presented as mean ± S.E.M. Data were analyzed with 2 × 2 mixed model ANOVA and simple main effect tests for pairwise comparison. Each horizontal line reports the simple main effect, and each square bracket reports the main effect of control vs. 6-OHDA in ANOVA. *p < 0.05, **p < 0.01, ***p < 0.001, N.S., nonsignificant.

