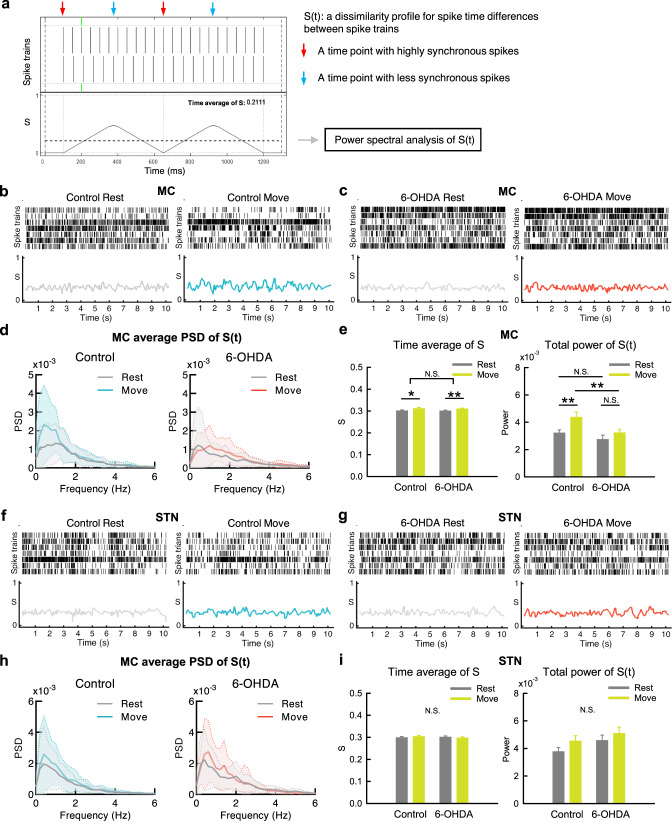
Fig. 6. Less spatiotemporal changes in MC discharges from rest to movement in parkinsonian rats.
a A diagram for the SPIKE-distance, a time-dependent dissimilarity score (S), in 2 simulate spike trains. The waveform denotes temporal profile of S (S(t)), and the dotted line denotes the time average of S. S(t) for 7 spike trains is calculated by averaging all pairwise S(t) (see “Method”, and also refer to Kreuz et al.112). b, c Sample raster plots of multi-unit spikes in MC and concomitant dissimilarity score (S), from a segment at rest (left) and the other one during movement (right) in a control rat (b) and a parkinsonian rat (6-OHDA, c). Note the apparently larger temporal changes in S during movement than at rest in control but not in parkinsonian rats. d The average power-frequency spectra of the whole temporal profile of S (S(t)) in all segments. n = 27 at rest and n = 23 during movement in control, and n = 35 at rest and n = 37 during movement in parkinsonian rats, from 10 control and 11 parkinsonian rats, respectively. Note the markedly enhanced peak at ~0.5 Hz from rest to movement in control but not in parkinsonian rats. e The time average of the dissimilarity score (S) of the 10-s segments in MC (left panel), and the total powers (0–250 Hz) of the spectral analyses from segments in part d (right panel). f–i Similar analyses to (b–e) were done on STN. n = 33 at rest and n = 34 during movement in control, and n = 22 at rest and n = 21 during movement in parkinsonian rats, from 10 normal and 11 parkinsonian rats, respectively (h, i). PSD spectra were presented as mean (solid curves) ± standard deviation (shaded areas). Data in the bar plot were presented as mean ± S.E.M. Data in (e) and (i) were analyzed with 2 × 2 independent model ANOVA and simple main effect tests for pairwise comparison. Each horizontal line reports the simple main effect, and each square bracket reports the main effect of control vs. 6-OHDA in ANOVA. *p < 0.05, **p < 0.01, N.S., nonsignificant.

