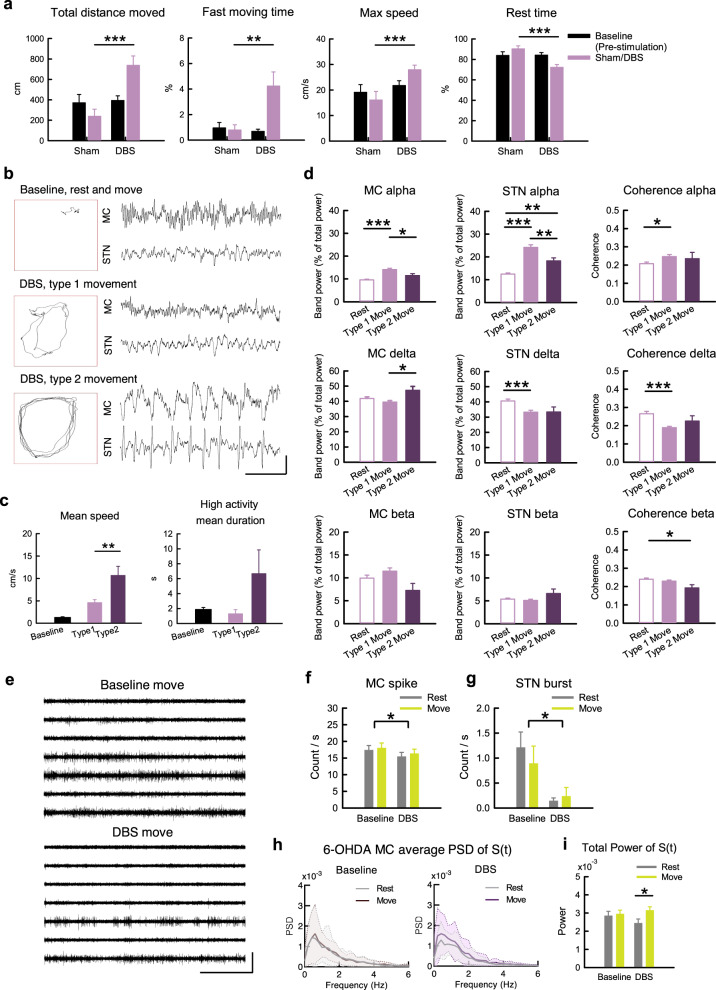
Fig. 8. Electrophysiological changes with prokinetic effects of STN-DBS in parkinsonian rats.
a Prokinetic effects of STN-DBS (depolarizing DC currents of −250 to −300μA) were examined in different parameters (n = 11 rats). b Sample maps of 30-s trajectories in OFT (boxes) and corresponding LFP recordings in MC and STN in a sample parkinsonian rat with baseline free running (including rest and movement), and type 1 and type 2 movements during DBS (Supplementary Movie 1 to 3). c Behavioral parameters in matched 30-s video recordings with type 1 and type 2 movements from the same OFT trial in parkinsonian rats. The “baseline” shows the data from sham stimulation in (a). n = 5 matched recordings from 3 rats. d Band power analysis according to the behavioral state during STN-DBS. n = 101, 76, and 14 10-s segments from 9 animals for rest, type 1 movement, and type 2 movement, respectively. e Sample sweeps of MU activities in MC from a parkinsonian rat during movement without (baseline) or with STN-DBS. f, g MC MU spike rates (f, n = 147 matches, i.e. 21 segments × 7 leads, from 7 animals) and STN bursts during STN-DBS (g, n = 5 matched segments from 4 leads from 2 animals). h, i Average PSD of S(t) (h) and the total power of S(t) (i) in MC (n = 37 at rest and n = 24 during movement in baseline, and n = 26 at rest and n = 34 during movement under STN-DBS, from 7 parkinsonian rats). PSD spectra were presented as mean (solid curves) ± standard deviation (shaded areas). Scale bars represent 1 s/500μV. Data in the bar plot were presented as mean ± S.E.M. Data were analyzed with ANCOVA (a), Mann–Whitney U tests (c), one-way ANOVA following Games–Howell post hoc tests (d), 2 × 2 dependent model ANOVA (f, g), and 2 × 2 independent model ANOVA (i). In (f) and (g), each horizontal line reports the simple main effect, and each square bracket reports the main effect of baseline vs. DBS in ANOVA. *P < 0.05, **p < 0.01, ***p < 0.001, N.S., nonsignificant.

