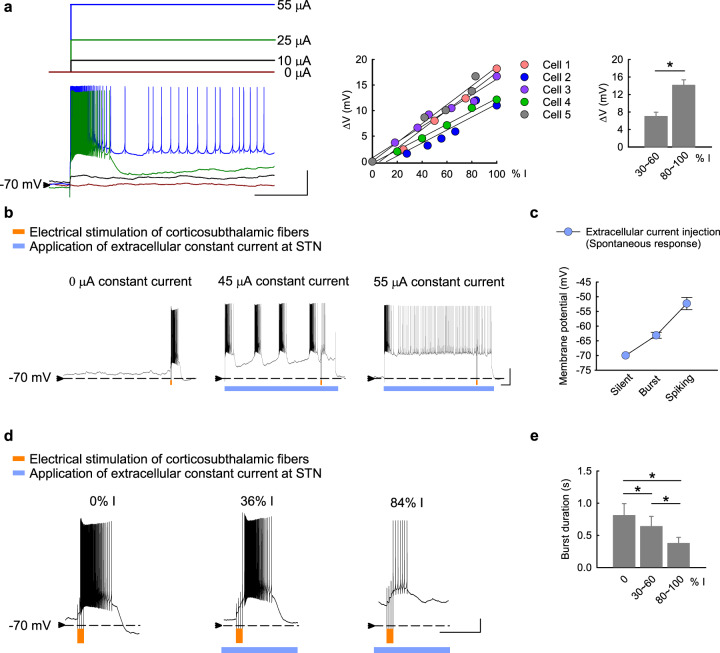
Fig. 9. Modulation of membrane potential and discharge patterns of STN neurons by extracellularly applied constant currents.
a The baseline membrane potential of STN neurons is changed correlative to the amplitude of extracellularly applied negative currents in acute brain slices from parkinsonian rats (left panel, n = 5). The percentage (% I) of the smallest current amplitude that switches the neuron into the spike mode of firing for each neuron is shown. There is tight correlation between the applied current amplitude and the change in membrane potential (∆V, middle and right panels). b Electrical stimulation of cortico-subthalamic fibers (orange marks, 4 pulses at 20 Hz) elicits subthalamic neuronal discharges, which are further modulated by the extracellular constant currents (blue bars). The 4-pulse stimulation elicits a burst of discharges outlasting the stimulation period in a STN neuron with a baseline membrane potential of ~−70 mV and without spontaneous activities (left panel). Application of an extracellular negative current of 45 μA modestly depolarizes the baseline membrane potential, at which spontaneous quasi-rhythmic burst discharges develop and the 4-pulse stimulation on cortical fibers elicits a shorter burst outlasting the stimulation period (middle panel). When a stronger extracellular negative current of 55 μA is given, the baseline membrane potential is even more depolarized and spontaneous spike discharges prevail. Here the same 4-pulse stimulation elicits no burst discharges but increases the spike frequency (only during but not outlasting the stimulation period, right panel). c The discharge pattern (electrical silence, spontaneously repetitive bursts, or spike-mode discharges) is closely correlated with the baseline membrane potential adjusted by extracellular constant currents (n = 4). d The duration of the burst discharges elicited by cortical fiber stimulation is the longest when no depolarizing extracellular currents are given (“0% I”), and gets shorter when stronger extracellular currents are given (e.g. “36 % I” vs. “84 % I”). e Cumulative results in (d) demonstrate a clear tendency of shorter burst duration with more depolarized baseline membrane potential upon extracellular current injection (n = 5–6). Scale bars represent 1 s/20 mV. Data with two groups were analyzed with Mann–Whitney U tests, and data with three groups were analyzed with Friedman tests (followed by the Wilcoxon signed-rank tests for further pairwise comparison). *P < 0.05.

