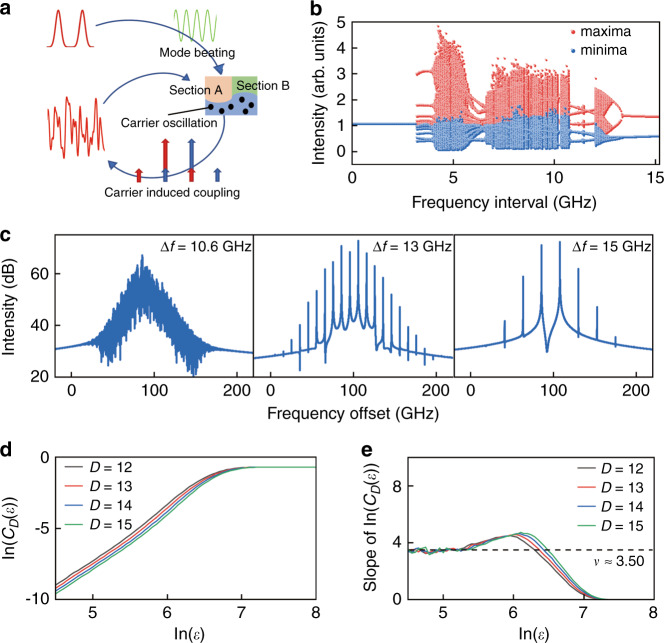
Fig. 2. Schematic diagram and simulated results of the rate equation.
a Schematical diagram of mode interaction, including mode beating intensity oscillation in the two sections, carrier oscillation caused by stimulated emission of beating intensity, the appearances of side peaks for lasing modes which can work as optical injection term for the other mode, and output power due to mode interaction. The long and small arrows represent the lasing modes and the side peaks caused by carrier oscillation. b Bifurcation of the extrema for the temporal output waveform versus dual-mode frequency interval. c Optical spectra of chaos, period-two, and period-one states at Δf = 10.6, 13, and 15 GHz, respectively. d Simulated correlation integral curve of the CD(ε) versus the sphere radius ε with embedding dimension D = 12 to 15 at Δf = 10.6 GHz, and e the slope of the integral curve is convergent to a correlation dimension ν ≈ 3.50

