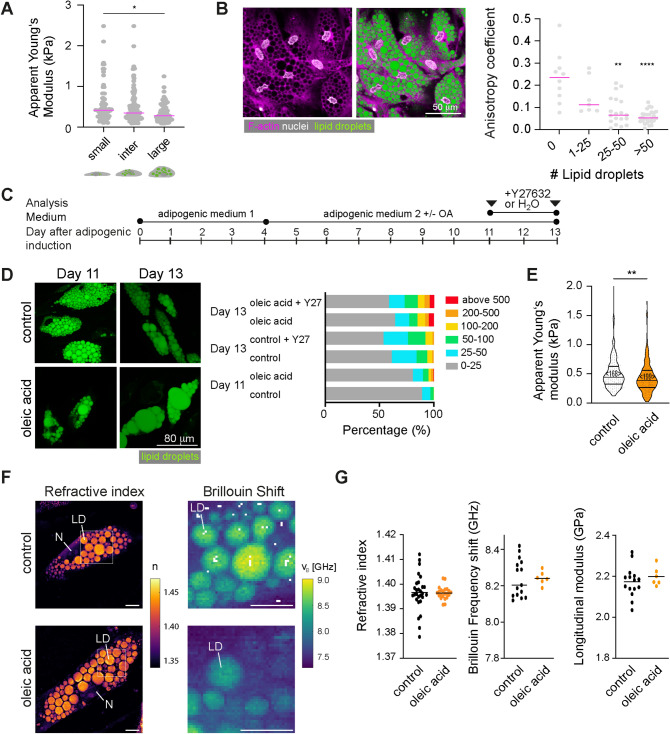
Figure 4.
Cell mechanical changes during feeding. (A) Apparent Young’s moduli for cells with small, intermediate, and large lipid droplets. Individual points indicate the mean apparent Young’s moduli measured per cell (data pooled from 5 independent experiments). (B) Confocal microscopy image of SGBS cells at day 11 after adipogenic induction (F-actin: Phalloidin-TRITC, magenta; nuclei: DAPI, white; lipid droplets: nile red (green). Anisotropy coefficient for cells depending on lipid droplet sizes (day 11 of adipogenic). Data in (A) and (B) are shown as scatter plots with lines corresponding to medians. Datasets were compared using a Kruskal-Wallis test combined with a Dunn’s multiple comparisons test. * denotes p-values <0.05. ** denotes p-values <0.01. **** denotes p-values <0.0001. (C) Schematics showing culture conditions for SGBS cells. (D) Nile red-stained SGBS cells on day 11 and 13 after oleic acid feeding (60 µM from day 4 on). Controls were treated with equal concentrations of the carrier BSA (fatty acid free). Right: Classification of lipid droplet sizes (in µm2) (analysed using Ilastik software) (E) Violin plots showing apparent Young’s moduli of control or oleic acid/treated cells (day 11). Data were compared by a Mann-Whitney test <n> represents the number of probed cells. (F) Representative ODT images (refractive index n) and Brillouin maps of selected regions (Brillouin shift vB) of controls and OA treated cells (day 11). Scale bar 10 µm. (G) Scatter plots showing refractive indices, Brillouin frequency shifts, and longitudinal moduli of lipid droplets. Individual dots represent the average values of one analysed cell. Lines indicate averages of different cells.

