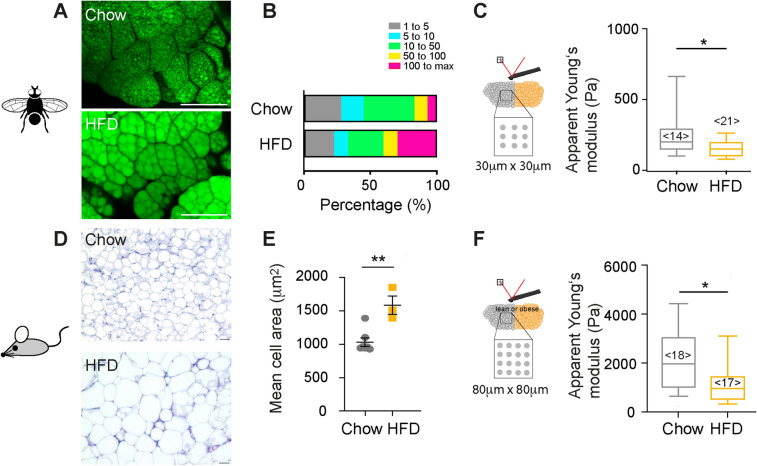
Figure 5.
Tissue mechanical changes during feeding. (A) Confocal microscopy images of drosophila fat bodies of animals fed on control (top) and lipid-rich (below) diet (lipid droplets stained with bodipy-505, green). Scale bar 100 µm (B) Quantification of lipid droplet sizes (in µm2) of drosophila fat bodies (n= 3 animals) in Fiji. (C) Boxplots showing apparent Young’s moduli of fat bodies, obtained by AFM indentation tests using a spherical indenter of 5µm radius on multiple positions. Data were compared by a Mann Whitney test. <n> represents the number of probed tissues. (D) H&E stainings of gonadal adipose tissue of lean and obese mice (chow and high fat diet HFD). (E) Quantification of cell sizes from histology stainings (in µm2). Scatter plots and mean +/- SEM are shown. Single points indicate averages of analysed microscopy images comprising in total at least 380 cells per condition. (F) Boxplots showing apparent Young’s moduli of gonadal adipose tissue, obtained by AFM indentation tests using a spherical indenter of 5µm radius on multiple positions. Datasets were compared using a Mann-Whitney test. ** denotes p-values <0.01, * p-values <0.05.

