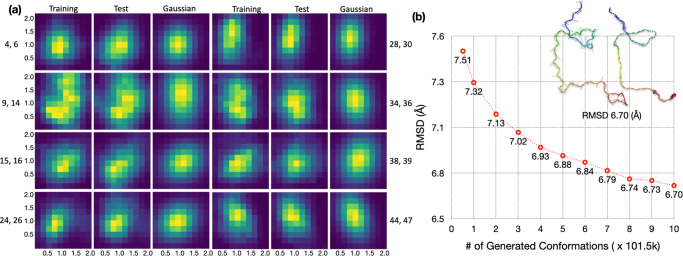
Fig. 5. Increased data overlap and prediction accuracy by combining MD runs of ChiZ.
a Histograms in the latent space, shown as heat maps, with yellow representing pixels with the highest counts and dark blue representing pixels with 0 count. Histograms were calculated for pairs of nonzero elements, using 52,200, 121,800, and 101,500 vectors from the training and test sets and the multivariate Gaussian, respectively. The training and test sets were from combining conformations sampled in 12 MD runs; the multivariate Gaussian was parameterized on the combined training set. b The average best-match RMSDs of the 1000-fold diluted, combined test set against generated sets at different sizes. The autoencoder was trained on a 10-folded diluted, combined training set (size = 52,200) from all the 12 MD runs. The sizes of the generated sets are measured in multiples of the test size in a single MD run (=101,500), and range from 0.51× (=training size) to 10×. The inset displays an IDP conformation and its generated best match, with an RMSD of the average value at 10×.

