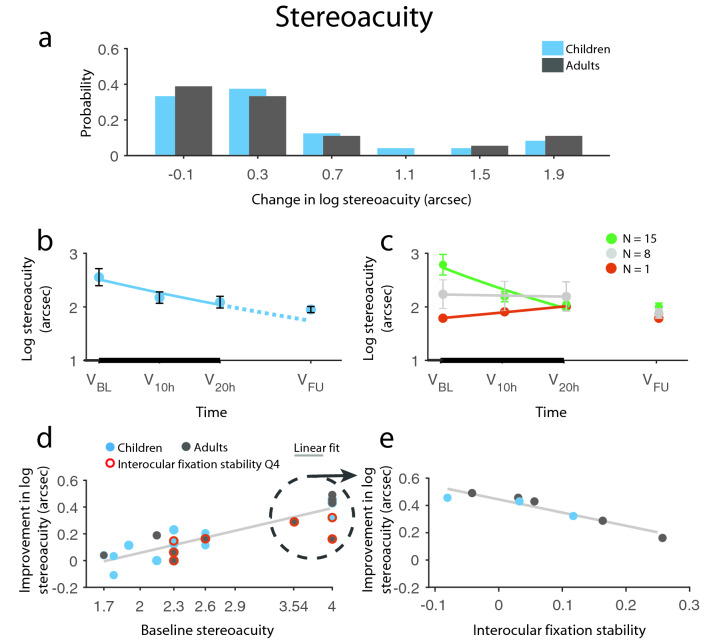
Figure 3.
Improvement in stereoacuity. (a) Distribution of change from baseline (CFB) in log stereoacuity in children and adults. (b) Time course of stereacuity recovery in children. The negative exponential fit indicates improvement (solid line) during the therapy (thick black line) and the expected improvement rate (dotted line) had the therapy been continued. Children’s improvement remained stable at 1-m follow-up without regression. (c) Division of children’s change over time based on the exponent of the fitted exponential: green, red, and gray indicates improvement, decline, and no change, respectively. Children showing stereoacuity decline during the treatment regained their baseline stereoacuity at follow-up. (d, e) Results of the prediction analysis: (d) Patients’ improvement depended on their baseline steroacuity: bigger improvement was possible with poorer initial stereoacuity. (e) Improvement of stereoblind or patients with crude stereoacuity (≥ 3500″) strongly depended on their relative fixation stability: the more stable the fixation was, the more patients improved. Red circles signify patients, whose relative fixation stability falls in the worst quarter (Q4), light gray line indicates a linear fit. NCh = 24, NAd = 18, except for (d, e), where NCh = 19, NAd = 13. Means ± SEM.

