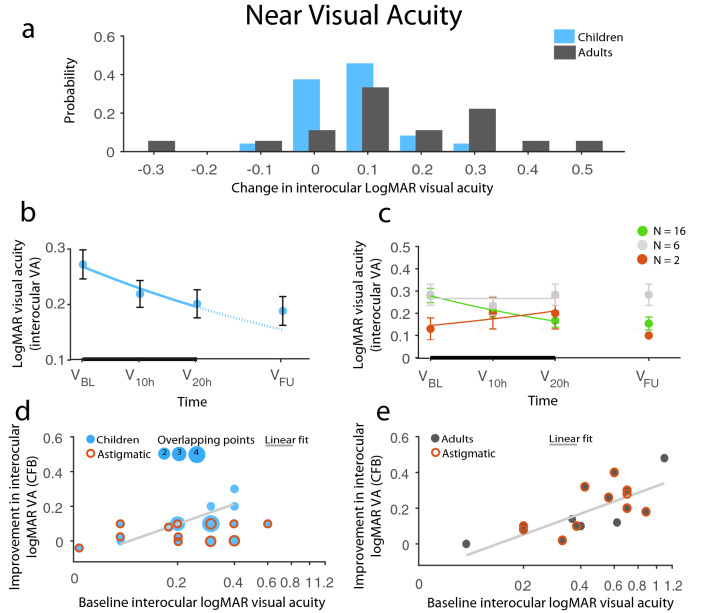
Figure 5.
Improvement in near logMAR visual acuity. (a) Distribution of change from baseline (CFB) in logMAR nVA in children and adults. (b) Time course of nVA recovery in children. The negative exponential fit indicates improvement (solid line) during the therapy (thick black line) and the expected improvement rate (dotted line) had the therapy been continued. Children’s improvement remained stable at 1-m follow-up without regression. (c) Division of children’s change over time based on the exponent of the fitted exponential: green, red, and gray indicates improvement, decline, and no change, respectively. Children showing nVA decline during the treatment regained their baseline nVA at follow-up. (d-e) Results of the prediction analysis: (d) Children’s interocular nVA recovery was strongly limited by the presence of astigmatism: non-astigmatic children’s potential for improvement increased with worse baseline interocular dVA, while astigmatic children did not show improvement regardless of their baseline value. (e) Adults’ progress, on the other hand, was not impacted by astigmatism, but solely depended on their baseline nVA. Red circles signify astigmatic patients, light gray solid line indicates a linear fit for non-astigmatic children, while the dashed line is the linear fit for astigmatic children. The size of data points and red circles corresponds to the number of overlapping data points. NCh = 24, NAd = 18, except for (d, e), where NCh = 23, NAd = 16. Means ± SEM.

