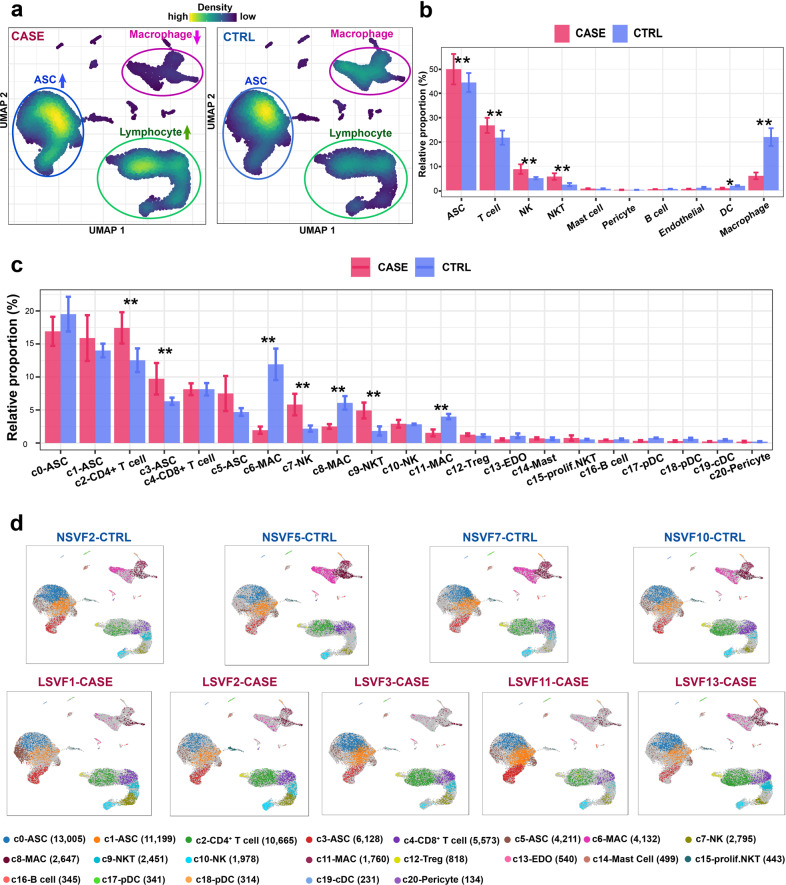
Fig. 2. Differential proportional analysis reveals significantly expanded or contracted cell lineages and subpopulations associated with cancer-related lymphedema.
a Visualization of the cellular density reveals dramatic changes in the proportions of multiple cell lineages in CASE versus CTRL. An equal number of cells (n = 28,935) were randomly sampled for each group. b Significantly expanded or contracted cell lineages. c Significantly expanded or contracted cellular clusters. d The distribution of cells for each cluster in each individual. In b and c, a permutation-based statistical test (differential proportion analysis) was performed. Data are represented as means ± SE. *Bonferroni-corrected P value < 0.05; **Bonferroni-corrected P value < 0.01. CASE, cancer-associated lymphedema; CTRL, healthy control.

