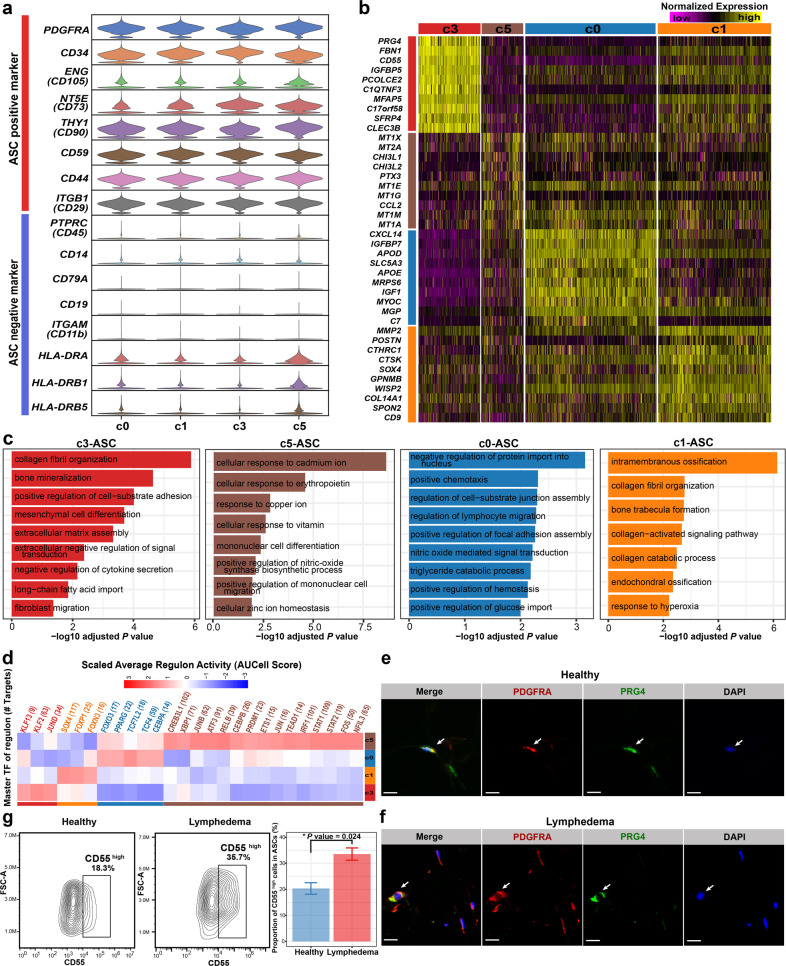
Fig. 3. Heterogeneity of ASCs in adipose tissues revealed by single-cell analysis.
a The expression of marker genes that are normally used for defining freshly isolated or cultured ASCs. b Distinct expression profiles of the four subpopulations of ASCs. c Enriched Gene Ontology terms of the molecular signature for each subpopulation. Adjusted P value < 0.05, the hypergeometric test. d Subpopulation-specific regulons of each subpopulation obtained by SCENIC analysis. e Immunofluorescence staining confirmed the presence of the c3-ASC subpopulation in the subcutaneous adipose tissues of lymphedema patients. Staining was performed in tissue sections of three patients. f Immunofluorescence staining confirmed the presence of the c3-ASC subpopulation in the subcutaneous adipose tissues of healthy donors. Staining was performed in tissue sections of two healthy donors. In e, f, one representative staining image of one subject is shown. Arrows indicate the PDGFRA+PRG4 high cells. Scale bar: 20 μm. g Flow cytometry analyses of the expression of CD55 (a marker for c3-ASC) in ASCs under lymphedema and healthy conditions. A validation cohort (Validation cohort I; n = 4 for the lymphedema group and n = 7 for the healthy group) independent of the samples subjected to scRNA-seq were used in this analysis. The left two panels show representative contour plots for each group. The bar plot indicates a significantly higher proportion of CD55high cells in ASCs (PDGFRα+) from lymphedema patients than that from healthy donors. Data are presented as means ± SE. *P value < 0.05. Wilcoxon rank-sum test. FSC-A forward scatter-area.

