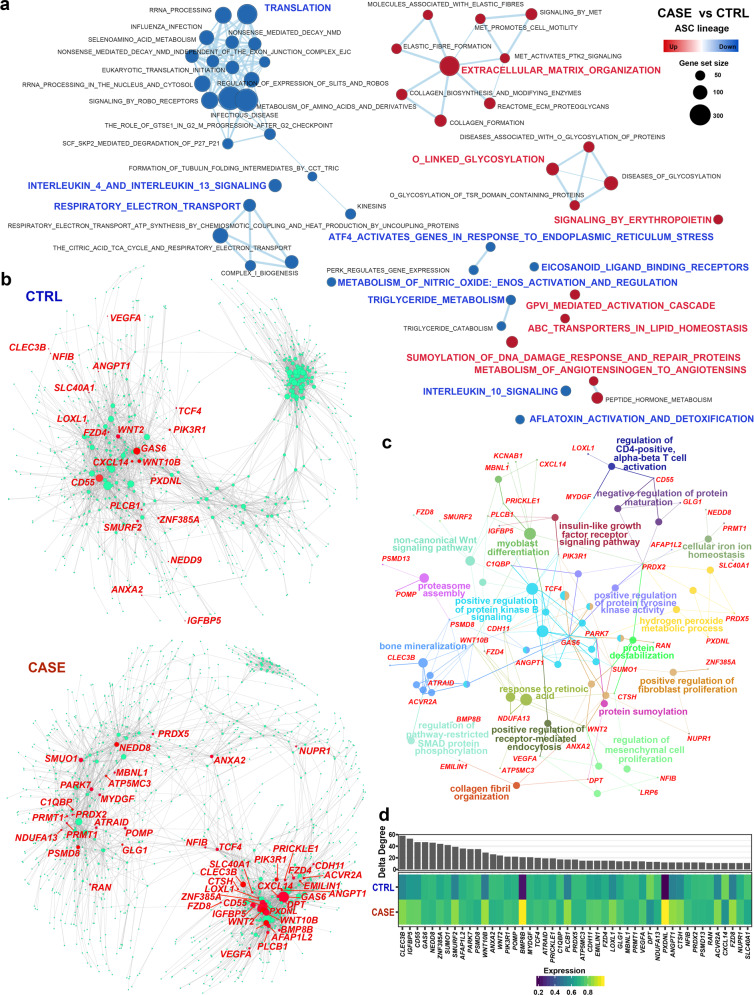
Fig. 4. Dysregulated genes and pathways of ASCs in adipose tissues from cancer-related lymphedema.
a GSEA reveals upregulated or downregulated pathways of ASCs in CASE versus CTRL. An FDR q value < 0.05 was considered to be statistically significant. b Comparative analysis of the gene regulatory networks of ASCs between the CASE (lower panel) and CTRL (upper panel) groups reveals dysregulated genes in ASCs. The node size reflects the degree centrality. The representative genes dysregulated in CASE ranked by delta degree are labeled in red. c Network view of the functional enrichment for the dysregulated genes shown in b. The small dots denote genes and large nodes represent Gene Ontology terms. The node size represents the number of genes associated with the Gene Ontology term. Adjusted P value < 0.05. d Delta degree centrality (upper panel) and average expression across cells in CASE and CTRL (lower panel). CASE, cancer-associated lymphedema; CTRL, healthy control.

