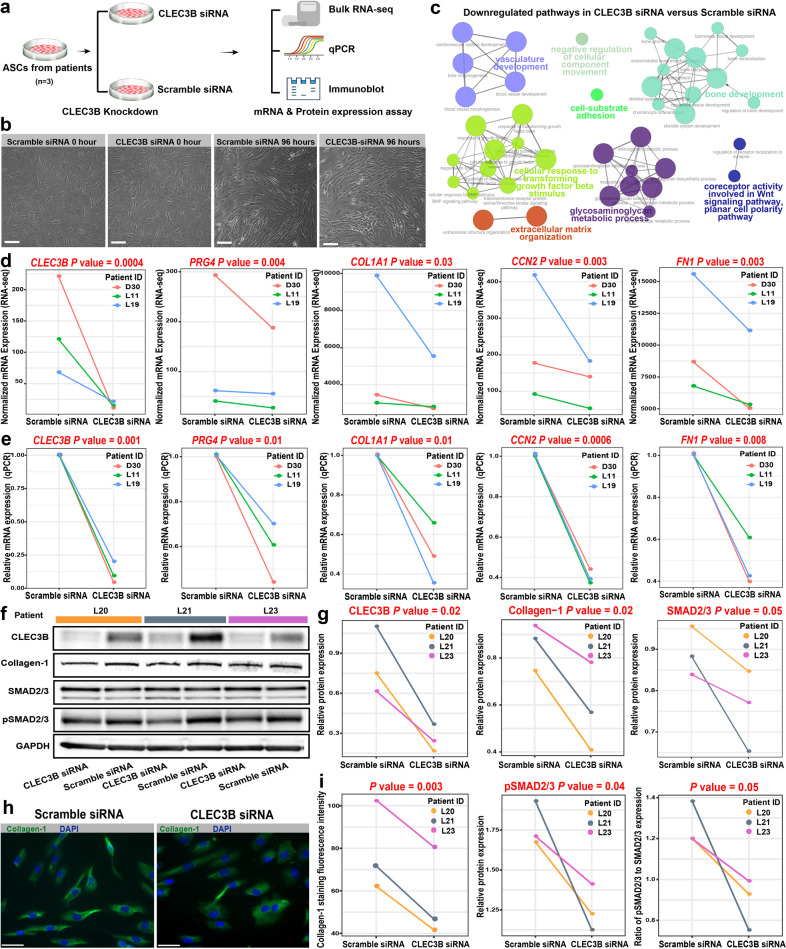
Fig. 5. Knockdown of CLEC3B could significantly attenuate the fibrogenesis of ASCs from lymphedema patients.
a Schematic representation of the experimental procedure. ASCs from patients (n = 3) were transfected with CLEC3B siRNA or scramble siRNA (negative control). The cells were harvested 48 h and 96 h after transfection for mRNA and protein analysis, respectively. b Images showing the ASCs after 96 h of transfection. Scale bar: 100 μm. c Network plot showing the downregulated pathways in ASCs with siRNA-mediated knockdown of CLEC3B versus the negative control. Functional enrichment analysis was performed on the differential expressed genes detected by bulk RNA-seq. Adjusted P value < 0.05, the hypergeometric test. d Significantly reduced mRNA expression of c3 markers and fibrosis-related genes in ASCs with CLEC3B knockdown versus the negative control (determined by bulk RNA-seq). The significance threshold was set to be a P value < 0.05 of the sleuth differential expression test. e Significantly reduced mRNA expression of c3 markers and fibrosis-related genes in ASCs with CLEC3B knockdown versus the negative control (determined by qPCR). The significance threshold was set to be a P value < 0.05 of the one-tailed paired t-test. f Immunoblot assays showing the decreased protein expression of CLEC3B, Collagen-1, SMAD2/3, and phosphorylated SMAD2/3 in ASCs with CLEC3B knockdown versus the negative control (n = 3). g Densitometry analysis of the immunoblot results. The significance threshold was set to be a P value < 0.05 of the one-tailed paired t-test. h Immunofluorescent staining of Collagen-1 in ASCs transfected with CLEC3B siRNA or scramble siRNA. Scale bar: 50 μm. Representative fields of view of ASCs from the patient L21 are shown. i Collagen-1 staining fluorescence intensity comparison. Each value represents the mean fluorescence intensity of three representative fields of view. Two-tailed paired t-test.

