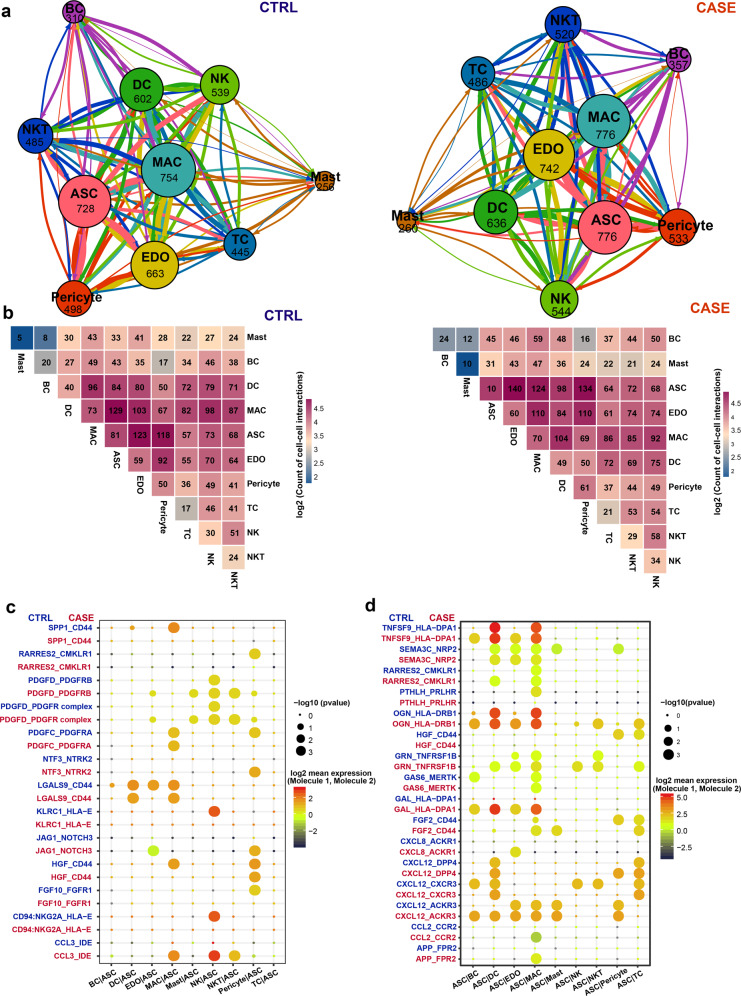
Fig. 7. Cell–cell communication analysis reveals a perivascular ligand–receptor interaction module and communication changes for ASCs in cancer-related lymphedema.
a Intercellular communication networks in the adipose tissues from patients with lymphedema (CASE; right panel) and healthy people (CTRL; left panel). The total number of communications is shown for each cell lineage. The line color indicates that the ligands are broadcast by the cell lineage in the same color. The line thickness is proportional to the number of broadcast ligands. b Heatmap shows the number of communications between any two lineages in the CASE (right panel) and CTRL (left panel) groups. c The ligand–receptor pairs showing significant changes in specificity between any one of the non-ASC lineages and ASCs in CASE versus CTRL. ASCs express receptors and receive ligand signals from other lineages. The dot size reflects the p value of the permutation tests for lineage specificity. The dot color denotes the mean of the average ligand–receptor expression in the interacting lineages. d The ligand–receptor pairs showing significant changes in specificity between ASCs and any one of the non-ASC lineages in CASE versus CTRL. ASCs express ligands and broadcast ligand signals for other lineages. ASC, adipose-derived stromal/stem/progenitor cell; BC, B cell; CASE, cancer-associated lymphedema; CTRL, healthy control; DC, dendritic cell; EDO, endothelial cell; MAC, macrophage; NK, natural killer cell; NKT, natural killer T cell; TC, T cell.

