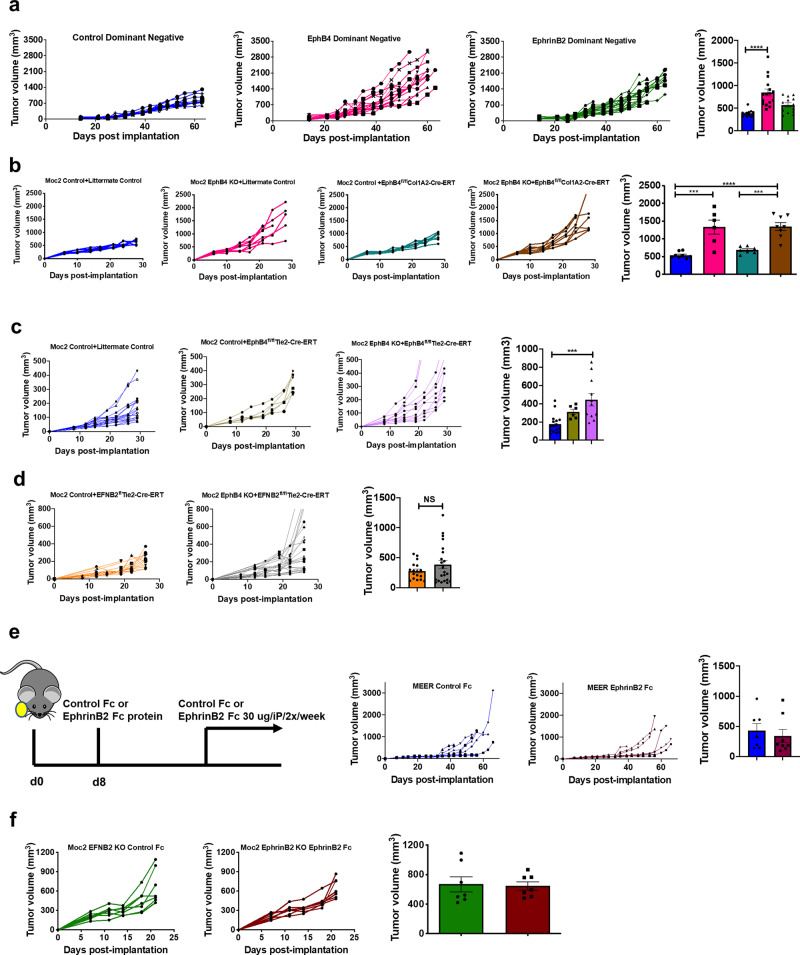
Fig. 4. Activating EphB4 on cancer cells in the absence of vascular ephrinB2 fails to reduce tumor growth in different models of HNSCC.
a EphB4 intracellular signaling in EphB4 dominant-negative constructs significantly enhances tumor growth in a patient-derived xenograft model. CUHN013 HNSCC cells transfected with either control or dominant-negative plasmids of EphB4 and ephrinB2 were implanted in the flank region of nude mice [n = 6 (control); n = 9 (EphB4 dominant negative); n = 10 (ephrinB2 dominant negative), and tumor growth was monitored and shown for individual mice in spaghetti plots in a time-dependent manner. The groups are annotated based on the tumor cells implanted in the respective mice. Dot plots are shown at day 42 post-implantation. Loss of EphB4 in collagen I-expressing cells such as fibroblasts in EphB4fl/flCol1A2-Cre-ERT mice (n = 6) (b) or in adult vasculature in EphB4fl/flTie2-Cre-ERT mice (n = 8) (c) did not significantly impact the tumor growth as compared to the littermate controls (n = 8). d Implantation of EphB4 KO tumor cells in EFNB2fl/flTie2-Cre-ERT mice with conditional deletion of ephrinB2 on the vascular endothelial cells failed to achieve tumor growth suppression. The groups in figures b–d are annotated in the format: “tumor name+mouse strain”. Tumor growth data is also shown in MEER control (n = 8) (e) and Moc2 ephrinB2 KO (n = 7) (f) tumor models where systemic administration of ephrinB2-Fc to activate EphB4 receptor failed to achieve tumor growth reduction in EFNB2fl/flTie2-Cre-ERT mice (n = 7). For figures e–f, groups are annotated based on the tumor cells implanted followed by Fc treatment. With the exception of b–d, other experiments were replicated two times. Color key for groups shown in histogram plots is the same as depicted in the respective spaghetti plots. Data are shown as mean ± SEM. Statistical significance was analyzed by performing a two-sided Student’s t-test or ANOVA. The Tukey’s test was used after ANOVA where multiple experimental groups were involved. p-values for the figures are indicated: a ****p < 0.0001, b blue vs brown bar ****p < 0.0001; blue vs pink bar ***p = 0.0001; teal vs brown bar ***p = 0.0007, c ***p = 0.0003.

