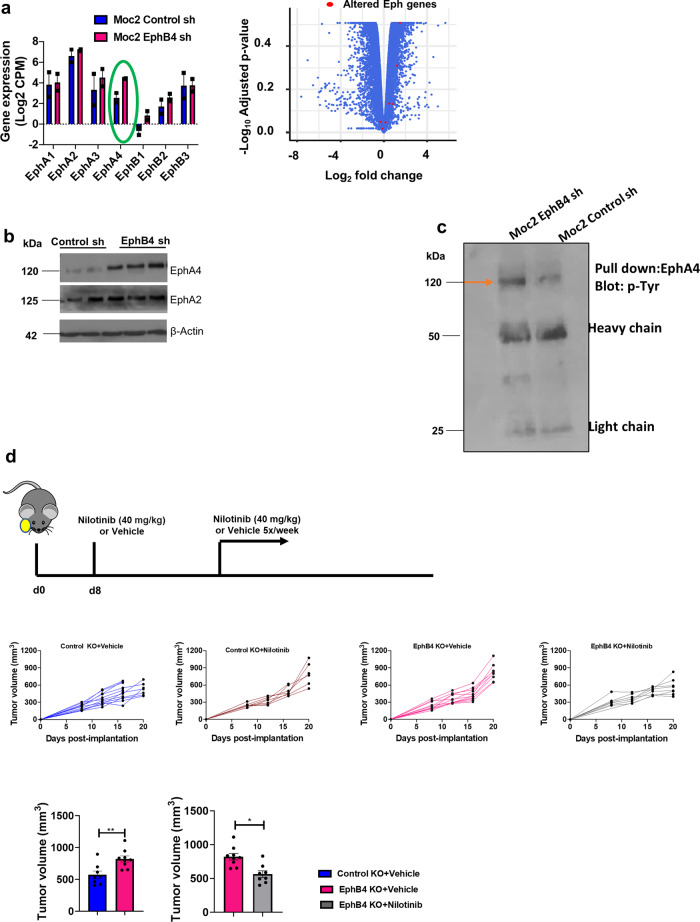
Fig. 6. Total and phospho-EphA4 levels are elevated following the loss of EphB4 on cancer cells and targeting EphA4 by broad-activity tyrosine kinase inhibitors reverses the accelerated tumor growth in EphB4 KO tumor-bearing mice.
a mRNA seq analysis show alterations in the gene expression of different Eph receptors following EphB4 knockdown in Moc2 tumors (n = 2). Alteration in Eph genes following EphB4 loss on tumor cells is also represented in the form of volcano plot. b Western blot analysis shows an increase in EphA4 levels following knockdown of EphB4 in Moc2 cancer cells, while EphA2 levels remain unchanged. c Immunoprecipitation analysis was performed to detect the phosphorylated levels of EphA4 in control vs EphB4 shRNA tumors. EphB4 knockout tumor cells were implanted in the buccal region of mice [n = 12 (blue); n = 7 (red); n = 11 (pink); n = 7 (blue)] followed by treatment with Nilotinib (d) tyrosine kinase inhibitor once the tumors reached a volume of ~150 mm3. The groups are annotated in the format: “tumor name+treatment”. Histogram plot shows significant decrease in inhibitor-treated versus control group at day 20 post-tumor implantation. The experiments were performed once with their own biological replicates. Data are shown as mean ± SEM. Statistical significance was analyzed by performing two-sided Student’s t-test. p-value: **p = 0.004, *p = 0.025.

