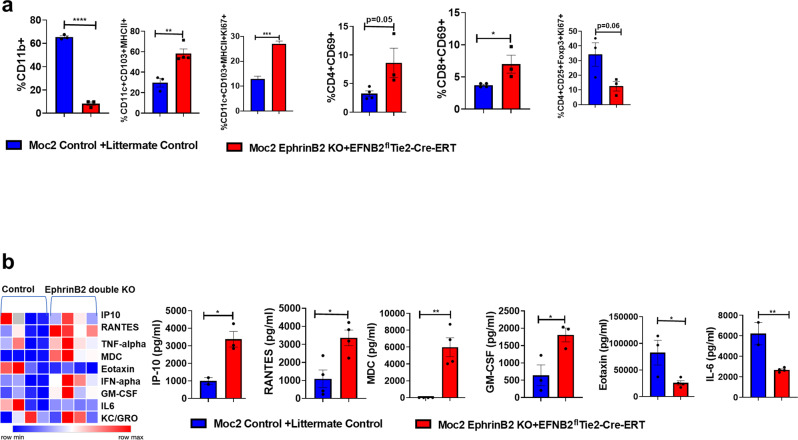
Fig. 8. Absence of ephrinB2 on tumor cells and vasculature reconditions the immune TME in a genetically engineered Moc2 tumor model.
a Tumors from the control and ephrinB2 double knockout (EphrinB2 KO + EFNB2fl/flTie2-Cre-ERT) groups were subjected to flow cytometry to determine changes in the immune profiles of T lymphocytes and dendritic cells. (n = 3/group) for CD11b+; n = 3 [control], n = 4 [ephrinB2 double knockout] for CD11c + CD103 + MHCII + and CD11c + CD103 + MHCII + Ki67 + ; n = 3/group for CD4 + CD25 + Foxp3 + Ki67+; n = 4 [control], n = 3 [ephrinB2 double knockout] for CD8 + CD69 + ; CD4 + CD69+ cells. b Serum samples from these mice n = 4 for MDC and RANTES; n = 2 [control], n = 3 [ephrinB2 double knockout] for IP-10; n = 3 [control], n = 4 [ephrinB2 double knockout] for Eotaxin; n = 2 [control], n = 4 [ephrinB2 double knockout] for IL6; n = 3 for GM-CSF was analyzed in a mesoscale cytokine assay to determine levels of circulating chemokines/cytokines affected by the loss of ephrinB2 in cancer cell and vascular compartments. For flow cytometric immune profiling, CD45 cells were used as a parent gate. Data are shown as mean ± SEM. Control mice refers to the littermate controls implanted with Moc2 control KO tumors. The experiments were performed once with their own biological replicates. Comparison between the control and experimental groups was done by using two-sided Student’s t-test. p-values are indicated for the figures: a ****p < 0.0001; **p = 0.006; ***p = 0.0002; *p = 0.039, b IP10 *p = 0.02; RANTES *p = 0.013; MDC **p = 0.0017; GM-CSF *p = 0.031; Eotaxin *p = 0.036; IL-6 **p = 0.006.

