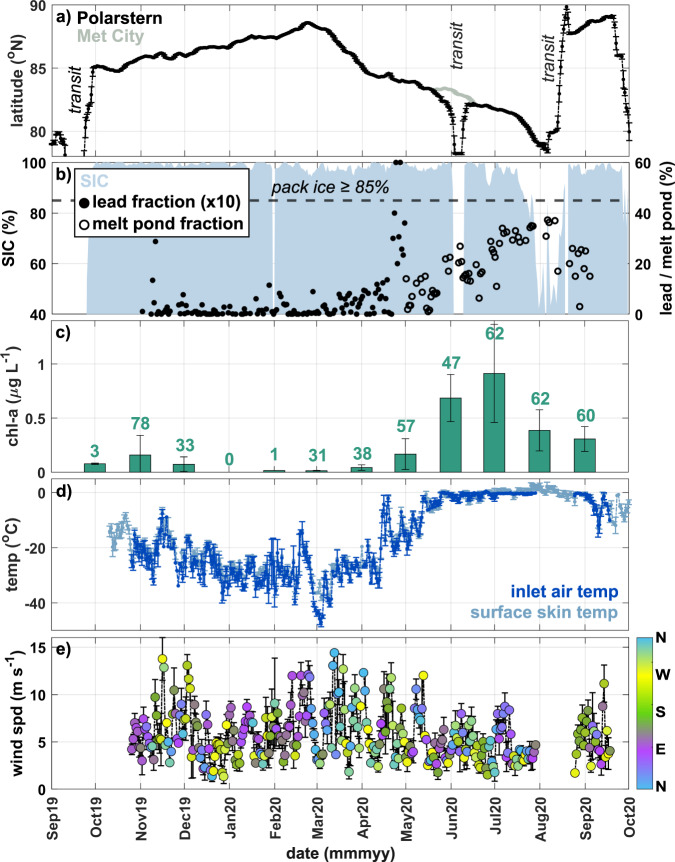
Fig. 2. Time series of floe location, sea ice, meteorology, and ecosystem data.
a Latitude measured on Polarstern and the Central Observatory (CO) at “Met City”, with transit periods denoted. b Sea ice concentration (SIC), and percentage of open water in the form of leads and melt ponds within a 1 × 1 degree grid around Polarstern. Lead percentage is multiplied by 10 to show variability. c Underway chlorophyll-a (chl-a) concentration measured from samples collected on Polarstern (values = number of discrete samples). d Temperature (temp) from the aerosol inlet on Polarstern and at the ice surface, and e wind speed (wind spd) colored by direction (N north, E east, S south, and W west), from “Met City”. All data aside from chl-a are either collected as or averaged daily. Error bars indicate standard deviation of the calculated averages.

